Council Budget 2022–23
Council Budget 2022–23
We have prepared our Council Budget 2022–23 in line with our commitment to sustainable budgeting, responsible financial management and the Victorian Government’s rate cap for 2022–23. Our budget also supports our community vision and priority themes in the Boroondara Community Plan 2021–2031.
Our budget aims to maintain and improve services and infrastructure, as well as deliver projects and services that are valued by our community.
We predict that this budget will have a surplus of $6.61 million. This is an increase of $10,000 from the 2021–22 forecast.
Our budget is largely based on a return to normal activity levels after COVID-19. However, we will continue to closely monitor any new COVID-19 developments.
In 2022–23, we will continue to invest in the delivery of services to our community, including:
- libraries
- health and wellbeing services
- family services
- youth services
- active ageing services.
We will also continue to invest in our infrastructure assets. This includes renewal works and new works for:
- roads
- footpaths and bicycle paths
- drainage
- recreational, leisure and community facilities
- parks, open spaces and streetscapes
- buildings.
As our city starts to recover from the impacts of COVID-19, this budget will make sure that Boroondara remains vibrant and inclusive, and a city that our community feels proud to live in.
Read the original Council Budget 2022–23
Table of contents
Total revenue and spending
Total revenue and spending
| Description | 2022–23 | 2021–22 |
|---|---|---|
| Total revenue | $259.13 million | $263.49 million |
| Total spending | $252.52 million | $256.89 million |
| Account result based on total income of $259 million | $6.61 million | $6.60 million |
|
Underlying operating result (This is an important measure of financial sustainability because it excludes capital income from being allocated to cover operating expenses) |
–$0.31 million | –$14.44 million |
We have adjusted the 2022–23 surplus result by $6.92 million as this relates to capital grants and open space contributions.
We have adjusted the 2021–22 deficit result by $21.04 million as this relates to capital grants and open space contributions.
Pagination links
Key investments for 2022–23
Key investments for 2022–23
Our 2022–23 Budget focuses on investing in some important projects.
Investments we are finishing
These include:
- The Canterbury Community Precinct. We are restoring and redeveloping the existing buildings in Canterbury Gardens and expect the new community precinct to be open in early 2023.
- The placemaking project for Maling Road in Canterbury. We have made significant progress to upgrade the laneway connecting Canterbury Station to the shopping strip. We are also planning to fund smaller arts and culture events and experiences in the shopping strip.
Investments into major projects
We have some major projects in development during 2022–23 that we expect to be completed over the next few years.
Some of these include:
- $73.1 million over 4 years for the Kew Recreation Centre redevelopment. We expect this project to be finished by the middle of 2023.
- $17.2 million over 4 years for the Tuck Stand refurbishment. We expect this project to be finished in the 2024-25 financial year.
- $17.0 million over 4 years for the Library Redevelopment in Kew. We expect this project to be finished in the 2025-26 financial year.
Investments into sustainability
We are investing $4.26 million in a range of environmental initiatives, including:
- $2.0 million to deliver a minimum 5-star Green Star equivalent standard for all new buildings and appropriate modifications.
- $1.0 million to reduce greenhouse gas emissions, including LED lighting and heating and cooling upgrades.
- $675,000 to support our ongoing park and street tree renewal program.
- $279,100 to improve and maintain urban biodiversity across the community. We will do this through programs like our Backyard Biodiversity project and Wildlife not Weeds program. We will also extend the areas of Boroondara that we manage for their significant biodiversity values.
Investments into sporting pavilions
We will upgrade our sporting pavilions to make sure they are accessible for everyone in our community. This includes:
- $1.3 million for Willsmere Park Pavilion
- $1.3 million for Greythorn Park Pavilion
- $2.2 million for Lewin Reserve Pavilion.
Investments into infrastructure
We will invest:
- $4.2 million for drainage renewal
- $2.1 million for footpath and cycleway renewal
- $12.6 million for road renewal
- $12.5 million for 13 other community building renewal works and minor works across many other properties we manage.
Investments into services
We will invest:
- $9.8 million to provide library services 7 days a week
- $9.2 million on health and wellbeing services, including immunisation, youth and recreation services
- $20.4 million for parks and gardens, biodiversity and street trees maintenance
- $3.5 million on arts and cultural services and events
- $12.3 million for planning, development and building controls
- $11.2 million for maintenance of the city’s infrastructure, including buildings, drainage, footpaths, roads and shopping centres.
Investments into open space
We understand there is limited open space in our community for recreation. We will invest $800,000 each year into our Open Space Acquisition Fund, which allows us to purchase additional open space when there is an opportunity.
Pagination links
What affected our 2022–23 Budget
What affected our 2022–23 Budget
External influences
COVID-19
The COVID-19 pandemic has had a big impact on our resources. For the first time in history, Boroondara had a budget deficit in the 2020–21 year. We estimate a total net loss of $41 million over financial years 2019–20, 2020–21 and 2021–22.
Victorian Government
Actions from the Victorian Government have had a big impact on our budget.
This comes from:
- the Victorian Government’s rate cap of 1.75%, which doesn’t allow us to fund enough services for our growing population
- the Victorian Government’s expected increase to its waste levy by 18.9%, or $20 per tonne. This means it will rise from $105.90 to $125.90 per tonne, an increase of $490,000 in 2022–23. The waste levy changes are part of the Victorian Government’s Recycling Victoria package. This is a 10-year action plan to encourage more recycling and reduce waste going to landfill
- ongoing cost shifting. This happens when a local government provides a service to the community for the Victorian or Australian Government. Over time, the cost for providing the service goes up, but the funding a local government receives doesn’t match it
- the Fire Services Property Levy that we collect for the Victorian Government.
Grant funding
We will receive $2.62 million for capital works grant funding. This includes $1.19 million from the Australian Government for the Local Roads and Community Infrastructure (LRCI) Program. This program will deliver priority road and community infrastructure projects.
We will also receive additional grant funding, which includes:
- $800,000 for the Canterbury Community Precinct from Victorian Government Department of Education and Training
- $593,811 from the Roads to Recovery Program funding, which we will use for roads and pavement renewal works.
Internal influences
Internal influences on our budget include projects that aren’t finished or haven’t started yet. This can be because of planning issues, weather delays or a longer consultation with the community. COVID-19 restrictions have also affected the timing and delivery of projects.
Employee costs are another internal influence. These are mostly driven by Council’s Enterprise. We have included an annual increase of 1.75% for all costs related to employees, such as wages, Work Cover and superannuation. In 2022–23 the compulsory Superannuation Guarantee Scheme (SGC) will also increase from 10.00% to 10.50%.
We will also continue to invest $11.23 million into our Transforming Boroondara project. This project will improve our customers’ experiences and efficiency of Council in the future.
Pagination links
How the Budget supports our Community Plan
How the Budget supports our Community Plan
In this section, we list the 7 themes of the Boroondara Community Plan and the services that fall under each of these themes. We detail the amount that each service costs, the amount we will make in revenue and the total net cost of that service.
Theme 1 – Community, Services and Facilities
Arts and Culture
Expenditure: $3,503,000
Revenue: $273,000
Net cost: $3,230,000
Asset Management
Expenditure: $3,413,000
Revenue: $0
Net cost: $3,413,000
Capital Projects
Expenditure: $2,876,000
Revenue: $16,000
Net cost: $2,860,000
Civic Services
Expenditure: $7,296,000
Revenue: $5,328,000
Net cost: $1,968,000
Community Planning and Development
Expenditure: $4,171,000
Revenue: $135,000
Net cost: $4,036,000
Health and Wellbeing
Expenditure: $9,118,000
Revenue: $7,318,000
Net cost: $1,800,000
Infrastructure Maintenance
Expenditure: $11,633,000
Revenue: $127,000
Net cost: $11,506,000
Liveable Communities
Expenditure: $8,269,000
Revenue: $5,671,000
Net cost: $2,598,000
Library Services
Expenditure: $9,794,000
Revenue: $1,247,000
Net cost: $8,547,000
Highlight project
Canterbury Community Precinct
We are restoring and developing the existing buildings in Canterbury Gardens. We expect construction to finish and the new community precinct to be open by early 2023.
This development includes heritage restoration works across the former Maternal and Child Health Centre, Canterbury Public Library and Bowls Club. This will connect to a new purpose-built facility and create a space to support health, wellbeing and early education needs. It will also give service providers a long-term home and help build strong community connections.
To find out more about these services, you can read about our themes in the Boroondara Community Plan.
Theme 2 – Parks and Green Spaces
Infrastructure Maintenance
Expenditure: $826,000
Revenue: $0
Net cost: $826,000
Landscape and design
Expenditure: $458,000
Revenue: $0
Net cost: $458,000
Open Space
Expenditure: $16,422,000
Revenue: $856,000
Net cost: $15,566,000
.
Highlight project
Tree Strategy Action Plan
We are proposing to implement our Tree Strategy Action Plan. This will fund the planting of 1,000 extra trees in addition to the 1,000 to 1,500 trees we’ve already committed to planting each year since we adopted the action plan in 2017.
To find out more about these services, you can read about our themes in the Boroondara Community Plan.
Theme 3 – The Environment
Environmental Sustainability
Expenditure: $1,593,000
Revenue: $0
Net cost: $1,593,000
Drainage and Asset Management
Expenditure: $628,000
Revenue: $80,000
Net cost: $548,000
Open Space
Expenditure: $1,589,000
Revenue: $0
Net cost: $1,589,000
Strategic and Statutory Planning
Expenditure: $621,000
Revenue: $355,000
Net cost: $266,000
Waste and Recycling
Expenditure: $25,191,000
Revenue: $1,436,000
Net cost: $23,755,000
Highlight project
Climate Action Plan
We will continue to prioritise funding towards the delivery of our Climate Action Plan. In 2022–23, we plan to deliver:
- an Urban Greening Strategy for Boroondara
- a program of advice and support for sustainable living, including a new focus on sustainable residential renovations
- measures to continue reducing greenhouse gas emissions from Council buildings, including buying 100% renewable electricity for Council buildings and public lighting.
To find out more about these services, you can read about our themes in the Boroondara Community Plan.
Theme 4 – Neighbourhood Character and Heritage
Asset Protection
Expenditure: $915,000
Revenue: $2,432,000
Net cost: –$1,517,000
Building Services
Expenditure: $2,573,000
Revenue: $1,987,000
Net cost: $586,000
Strategic and Statutory Planning
Expenditure: $8,231,000
Revenue: $2,741,000
Net cost: $5,490,000
.
Highlight project
Boroondara Housing Strategy
We are planning to review and update our Boroondara Housing Strategy. This will help us understand:
- the best ways to meet our community’s housing needs over the next 15 years
- how to protect Boroondara’s heritage and character
- issues around diversity, affordability, equity and sustainability.
To find out more about these services, you can read about our themes in the Boroondara Community Plan.
Theme 5 – Moving Around
Civic Services
Expenditure: $4,179,000
Revenue: $11,542,000
Net cost: –$7,363,000
Road Maintenance and Repair
Expenditure: $1,344,000
Revenue: $90,000
Net cost: $1,254,000
Traffic and Transport
Expenditure: $1,580,000
Revenue: $0
Net cost: $1,580,000
.
Highlight project
Shared path and park lighting upgrades
We will explore lighting solutions, including the use of solar and energy efficient LED lighting, for the Gardiners Creek Trail underpass at Toorak Road and along the Anniversary Trail between Whitehorse Road and Canterbury Road.
To find out more about these services, you can read about our themes in the Boroondara Community Plan.
Theme 6 – Local Economy
Local Economies
Expenditure: $3,344,000
Revenue: $1,419,000
Net cost: $1,925,000
Minor shopping centre upgrade and maintenance
Expenditure: $331,000
Revenue: $0
Net cost: $331,000
.
.
Highlight project
Maling Road Placemaking
In 2020, we shared the community’s vision for the future of Maling Road in Canterbury. We have made significant progress to upgrade the laneway connecting Canterbury Station to the shopping strip. We are also planning to fund smaller arts and culture events and experiences in the shopping strip.
To find out more about these services, you can read about our themes in the Boroondara Community Plan.
Theme 7 – Governance and Leadership
Chief Financial Office
Expenditure: $6,914,000
Revenue: $3,206,000
Net cost: $3,708,000
Council Operations
Expenditure: $381,000
Revenue: $0
Net cost: $381,000
Councillors, Chief Executive Officer, Executive Management and support staff
Expenditure: $2,885,000
Revenue: $0
Net cost: $2,885,000
Customer Support and Corporate Information
Expenditure: $7,336,000
Revenue: $0
Net cost: $7,336,000
Digital
Expenditure: $1,978,000
Revenue: $0
Net cost: $1,978,000
Governance and Legal
Expenditure: $5,779,000
Revenue: $52,000
Net cost: $5,727,000
Information Technology
Expenditure: $11,020,000
Revenue: $0
Net cost: $11,020,000
People, Culture and Development
Expenditure: $3,752,000
Revenue: $0
Net cost: $3,752,000
Strategic Communications
Expenditure: $4,197,000
Revenue: $0
Net cost: $4,197,000
Strategy and Performance
Expenditure: $1,730,000
Revenue: $0
Net cost: $1,730,000
.
.
Highlight project
Transforming Boroondara
We are transforming Boroondara to improve customer experiences and service delivery across Council, making it easier for customers to get the information and services they need in a way that’s convenient for them. To help achieve this, we are prioritising funding to better support processes and technology to modernise our core business systems, which will enable a more responsive and efficient service.
To find out more about these services, you can read about our themes in the Boroondara Community Plan.
Pagination links
Summary of our financial position
Summary of our financial position
This summary provides important information about our:
- operating result
- services we deliver to the community
- cash and investments
- Capital Works Program
- financial sustainability.
The following graphs show the 2021–22 forecast actual, which is marked with an F before the date.
The graphs also show the budget for 2022–23, 2023–24, 2024–25 and 2025–26. These are marked with a B before the date.
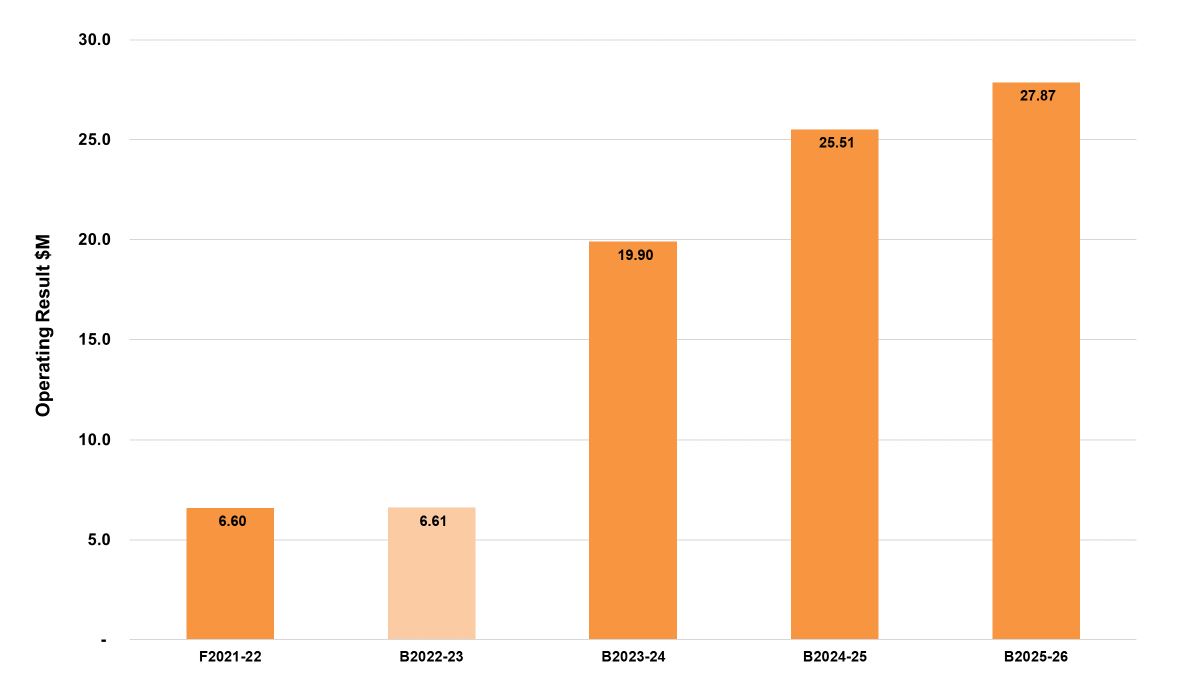
Operating result
The operating result recognises all revenue and spending for Council to operate and includes non-cash items like depreciation.
We expect our operating result for the 2022–23 year to be a surplus of $6.61 million. This is a $10,000 increase from the forecast surplus result of $6.60 million for 2021–22.
The operating result and future years can change depending on the number of priority projects planned.
Our adjusted underlying result is a deficit of $310,000, which is an increase of $14.13 million over 2021–22. The adjusted underlying result doesn’t include items such as non-recurrent capital grants, non-cash contributions and cash capital contributions.
The forecast underlying result for the 2021–22 year is a deficit of $14.44 million. The 2021–22 adjusted underlying result is $21.04 million. This amount doesn’t include capital grants and contributions.
When we talk about a surplus or deficit, this isn’t a measure of ‘profit’. It tells us about the capacity we have to fund future capital works.
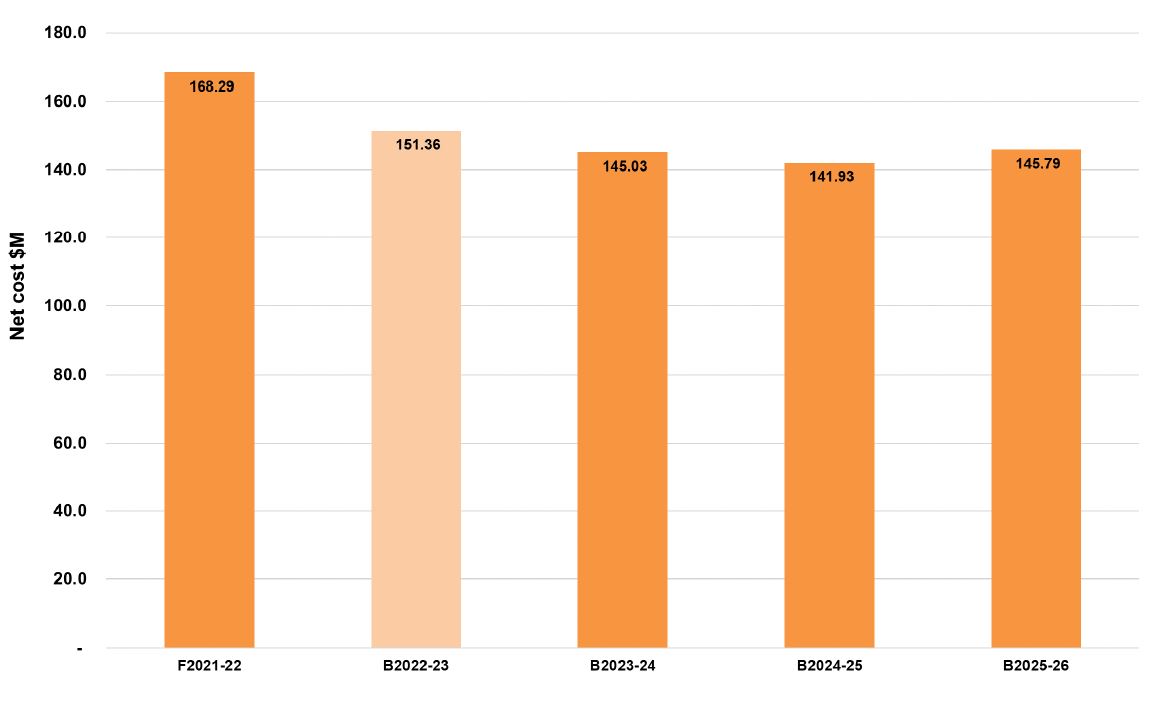
Services we deliver to the community
The net cost of services we deliver to the community includes the net costs to run services after receiving income from them, as well as net spending on priority projects. For the 2022–23 year, we expect the net cost of services we deliver to be $151.36 million. This is a decrease of $16.93 million over 2021–22.
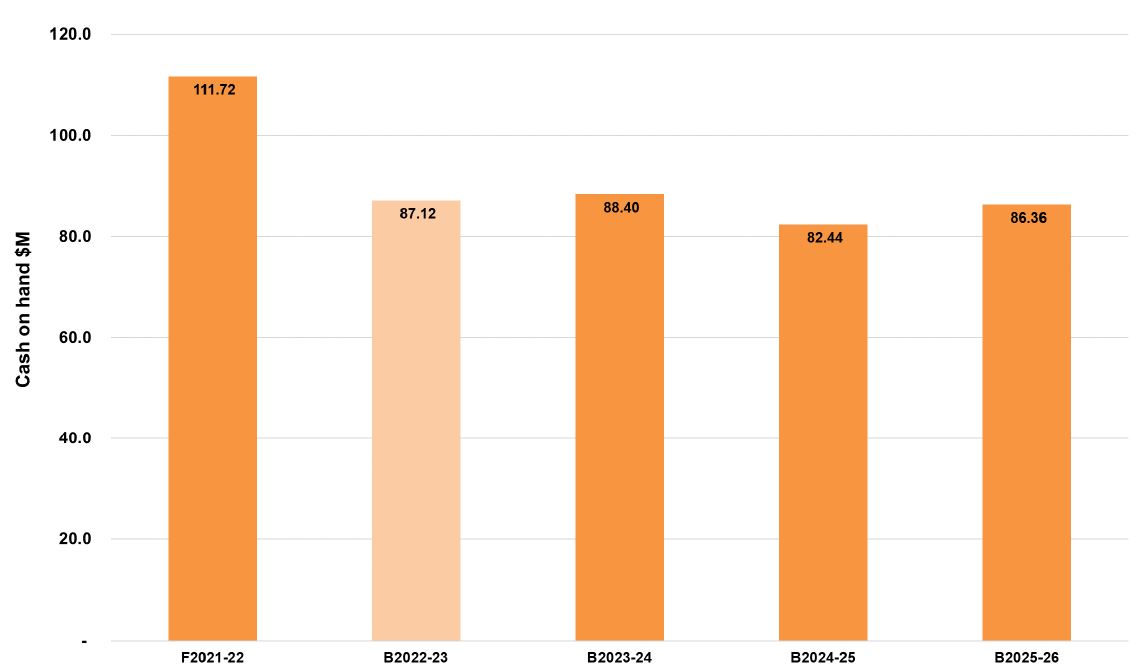
Cash and investments
We use cash and investments to fund the Capital Works Program and repay existing borrowings.
In our budget, we have decreased cash and investments by $24.60 million to $87.12 million for the year ending 30 June 2023.
We are also reviewing our loan portfolio and looking at the opportunity to refinance our 2012–13 loan over 10 years starting in 2022–23.
We expect to refinance loan borrowings of $19.70 million during the 2022–23 year. This will help to fund strategic capital works projects.
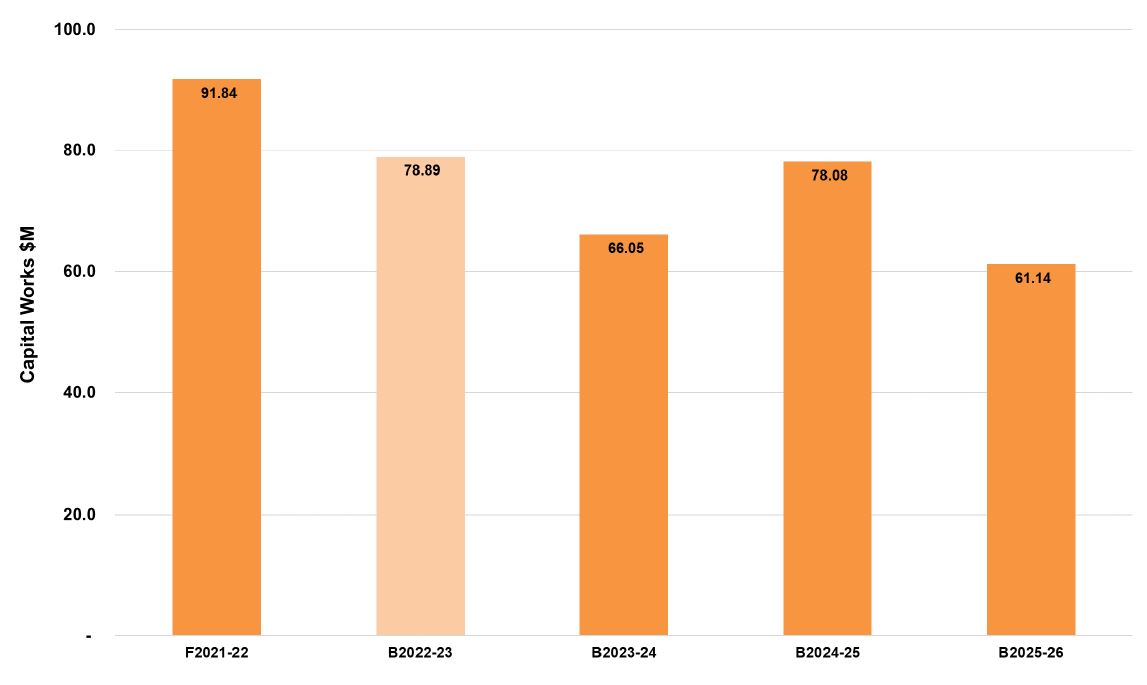
Capital Works Program
Our commitment to capital works will reach $78.89 million for the 2022–23 financial year. Of this amount, $8.51 million is for commitments we carried over from the 2021–22 year. These commitments are fully funded from the 2021–22 Budget.
To achieve our commitment to capital works:
- We are reviewing our loan portfolio and looking at the opportunity to refinance our 2012–13 loan over 10 years, starting in 2022–23.
- We expect to refinance $19.70 million of loan borrowings during the 2022–23 year to fund strategic capital works projects.
- We will use $2.62 million of capital funding from successful grant applications.
- We have committed to spend $53.60 million for renewal projects. We have also committed to spend $25.29 million for new, upgrade and expansion projects. This includes commitments we have carried over.
You can find out more on Our Capital Works Program 2022–23 page.
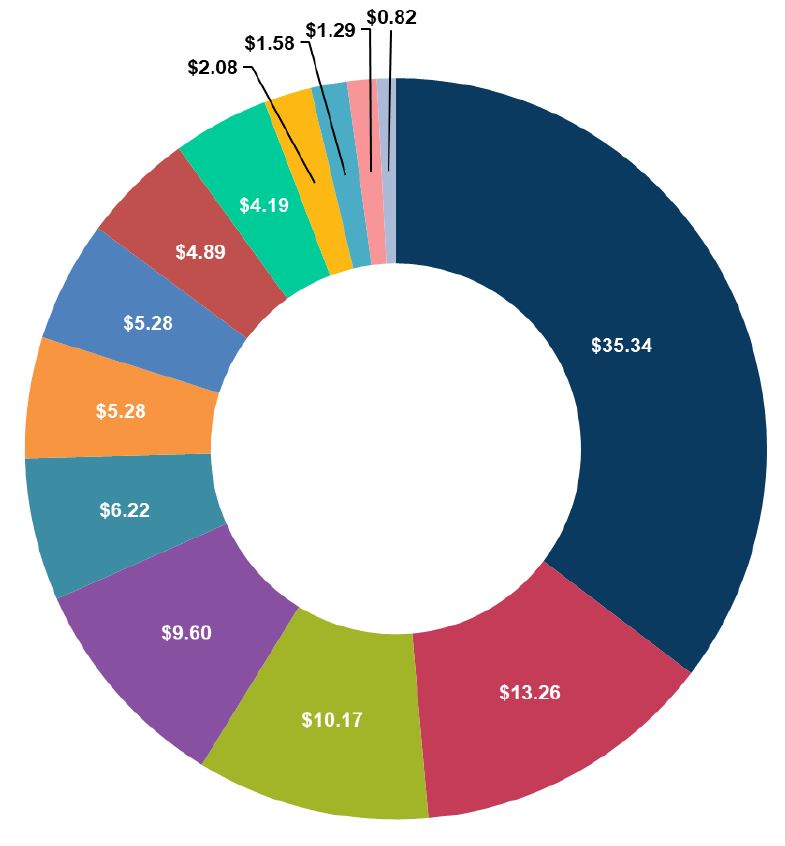
How we spend money across services
We have broken down how we spend our money across the main services we deliver. For every $100 we spend:
- $35.34 is for Capital Works and Priority Projects
- $13.26 is for Environment and Waste Management
- $10.17 is for Health, Aged Community and Family Services
- $9.60 is for Parks, Gardens and Sportsgrounds
- $6.22 is for Library, Arts and Cultural Services
- $5.28 is for Planning and Building
- $5.28 is for Communications and Customer Service
- $4.89 is for Local Laws Enforcement
- $4.19 is for Roads, Footpaths, Safety and Drainage
- $2.08 is for Engineering and Traffic
- $1.58 is for Rates and Property Services
- $1.29 is for Leisure and Recreation and Civic Centres
- $0.82 is for Economic Development.
Pagination links
Financial statements
Financial statements
Our financial statements include projections for the 4 years ending 30 June 2026.
This section includes the following financial statements prepared in line with the Local Government Act 2020 and the Local Government (Planning and Reporting) Regulations 2020.
Comprehensive Income Statement
Find information about the income and expenses for the 4 years ending 30 June 2026.
Downloads
Balance Sheet
Find information about:
- current assets
- non-current assets
- current liabilities
- non-current liabilities.
Downloads
Statement of Changes in Equity
Find information about the:
- balance at beginning of the financial year
- surplus (or deficit) for the year
- net asset revaluation inrease (or decrease) of Council’s assets, such as property, infrastructure, plant and equipment
- transfer to or from our other reserves, including our Open Space Reserve, Defined Benefits Superannuation call up fund, Strategic Acquisition Fund and the Drainage Reserve
- balance at end of the financial year.
Downloads
Statement of Cash Flows
Find information about the:
- cash flows from operating activities
- investing activities
- financing activities.
Downloads
Statement of Capital Works
Find information about the:
- budget for property projects
- budget for plant and equipment projects
- budget for infrastructure projects
- funding sources, including grants, contributions, asset sales, Council cash and borrowings.
Downloads
Statement of Human Resources
Find information about what we spend on our staff and our staff numbers.
Downloads
Pagination links
How we measure our performance
How we measure our performance
Find out about our current and projected performance across important financial performance indicators. These indicators give a useful analysis of our financial position and performance. They should be read with an understanding of the context of the organisation’s objectives.
These financial performance indicators are set out in Part 3 of Schedule 3 of the Local Government (Planning and Reporting) Regulations 2020.
They include:
- Operating position
- Liquidity
- Obligations
- Stability
- Efficiency.
We will report results against these indicators in the Performance Statement of our Annual Report.
Downloads
Pagination links
2022-23 Fees and charges
2022-23 Fees and charges
We provide a range of services to the Boroondara community. To pay for these services, we either charge a fee to use them or we apply a levy.
Our Pricing Policy makes sure that we set fees in line with activites to support community objectives. These are activities that we wouldn't normally do, however, the state or federal government has requested and funded them to meet a certain objective.
When we set fees and charges, we think about:
- people’s ability to pay
- equity in how services are subsidised
- community service obligations
- legal or service agreement limitations, such as building permits or statutory planning fees
- results from benchmarking of similar services.
We also need to think about an increase in labour costs to deliver a service. In 2022–23, this has resulted in an average increase of 2.05% to our fees and charges for services requiring labour.
Fees for services that don’t require labour, generally increase in line with the Victorian State Government’s rate cap. This is set at 1.75% in 2022–23.
Some of our fees and charges may have slightly different percentage increases because of rounding. Our fees and charges also might change throughout the 2022–23 year.
If fees are set by the state government, we aren’t able to change them. For example, the Victorian Government waste levy is expected to increase by 18.9% or $20 per tonne from $105.90 to $125.90 per tonne (an increase of $490,000) in 2022–23.
Waste management fees
We charge waste management fees to pay for:
- the waste to landfill service
- the food organics and green organics waste service
- the recycling service
- hard-waste collection
- operating the Riversdale Road Transfer Station
- operating the Clayton Landfill
- delivering street sweeping services
- public place waste and recycling services
- bin renewal
- disposing of electronic waste.
We also charge waste management fees to pay for waste collection at:
- public parks
- gardens
- sportsgrounds
- community buildings.
In our 2022–23 Budget, we are proposing an average increase of 0.6% for waste charges in Boroondara, which factors in the Victorian government waste levy. This levy is part of the state government’s Recycling Victoria package, which is a 10-year action plan to encourage more recycling and reduce waste to landfill.
Waste bin charges for 2022–23
| Household waste bin size (landfill) | 2021–22 charge | 2022–23 charge |
|---|---|---|
| Waste environment levy residential and other | $120 | $120 |
| Waste environment levy commercial | $120 | $120 |
| 80-litre and minimum waste charge residential and other | $261 | $262 |
| 80-litre commercial | $261 | $262 |
| 120-litre residential and other | $477 | $477 |
| 120-litre commercial | $477 | $477 |
| 240-litre (only for residential properties with 4 or more people in a household) | $1,160 | $1,161 |
| 240-litre commercial (only for commercial properties) | $1,160 | $1,161 |
| 240-litre concession (concessional fee for residential properties with a specific medical condition) | $954 | $955 |
Fees and charges
Download and view the fees and charges for our services.
Arts and Cultural Services
Asset & Capital Planning
CEO's Office
Civic Services
Community Support
Customer and Transformation
Environmental Sustainability & Open Spaces
Library Services
Liveable Communities
Places and Spaces
Strategic and Statutory Planning
Traffic and Transport
Urban Living
Pagination links
2022–23 Rates and Charges
2022–23 Rates and Charges
Visit Pay your rates for information on paying your rates notice. You'll need to contact us for copies of old rates notices.
Rate percentage increases
The Local Government Act 2020 requires us to have a Revenue and Rating Plan. This is a plan for how we will generate income to deliver the Council Plan, programs and services, and capital works commitments for the next 4 years.
Our rates and charges are an important source of revenue. They make up 77% of the total revenue we receive each year.
The Minister for Local Government announced that the average property rate cap for 2022–23 will rise by 1.75%. We won’t be asking for any changes to this rate cap.
We have used the Department of Treasury and Finance forecasts of the consumer price index to estimate a 2% rate cap rise for future years.
| Year | Rate increase % |
|---|---|
| 2023 | 1.75% |
| 2024 | 2% |
| 2025 | 2% |
| 2026 | 2% |
| 2027 | 2% |
Forecast of rates and charges
The table below is an overview of our rates and charges. It shows what we forecast in 2021–22 compared to the actual 2022–23 budget.
| Type or class of land | Forecast actual 2021–22 | Budget 2022–23 | Change in dollars | Change in percentage |
|---|---|---|---|---|
| General rates | $165,514,722 | $169,984,617 | $4,469,895 | 2.6% |
| Supplementary rates and adjustments | $900,000 | $900,000 | $0 | 0% |
| Waste management charge | $31,510,000 | $31,686,000 | $176,000 | 0.6% |
| Interest on rates and charges | $625,000 | $550,000 | –$75,000 | –13.6% |
| Special rate schemes | $1,419,378 | $1,374,555 | –$44,823 | –3.3% |
| Less early payment discount | –$855,944 | –$857,016 | –$1,072 | 0.1% |
| Cultural Recreation charges | $54,753 | $56,002 | $1,249 | 100% |
| Total rates and charges | $199,167,909 | $203,694,158 | $4,526,249 | 2.2% |
Rates and property value
The Valuer General of Victoria took over the rateable property general valuation process in 1 July 2018. It also changed this process to happen every year instead of every 2 years.
Under the Local Government Act 1989, local governments can increase rate revenue through valuations of properties. The Valuer General of Victoria works out and certifies the Capital Improved Value (CIV) of properties. We then use the CIV to work out the rates.
The way rates are charged is the same for residential and business properties.
Detailed rates and charges
Rate payment options
In 2022–23, we will offer different ways to pay your rates. We will also apply a 2% discount if you pay in full by 31 August 2022.
Payment options include:
- one lump sum payment
- one lump sum payment in full by 15 February 2023. Direct debit is available for this option
- pay in 4 instalments. Payments are required on 30 September, 30 November, 28 February, and 31 May 2022. Direct debit is available for this option
- a direct debit (interest free) payment plan. Pay once a month over 10 months with direct debit.
You can find out more about paying your rates on our Pay your rates page.
Pagination links
General revaluation of properties
General revaluation of properties
In 2022–23, we found that the value of property across Boroondara has increased by 10.34%. This includes a 10.81% increase in value for residential properties and a 3.55% increase in value for non-residential properties compared to the last financial year.
We also found out there will be a decrease in the rate in the dollar paid by ratepayers. This will be a reduction from 0.13720849 cents in the dollar to 0.12653020 cents in the dollar.
A property in Boroondara at the median residential valuation in 2021 was valued at $1,400,000 with a general rate of $1,920.92. The new median valuation for 2022, according to the Valuer General of Victoria, is $1,500,000 and now attracts a general rate of $1,897.96. This is a decrease of $22.96 per year or $0.44 per week.
It’s important to note that when a revaluation is carried out, the total rate revenue that we receive doesn’t change. We don’t make any extra revenue.
A revaluation can change how the rates between properties are allocated. If the value of a property is higher than the average value for other properties, that property receives a higher rate increase compared to the general rate increase for other properties.
However, if the value of a property changes to become less than average, that property receives a lower rate increase compared to the general rate increase for other properties.
The following tables summarise the valuation changes between the 2021 and 2022 general revaluations for all property types including analysis by suburb.
All property types
| Property type | Number of properties | 2021 CIV | 2022 CIV | CIV % change |
|---|---|---|---|---|
| Residential Vacant Land | 775 | $1,529,565,000 | $1,761,275,000 | 15.15% |
| Houses | 41,371 | $89,041,730,000 | $99,852,980,000 | 12.14% |
| Flats | 1,681 | $968,840,000 | $1,040,760,000 | 7.42% |
| Units | 29,938 | $22,211,850,000 | $23,389,910,000 | 5.30% |
| Specialty (Retirement) | 18 | $118,600,000 | $131,550,000 | 10.92% |
| Non-residential – rateable | 5,953 | $7,886,733,000 | $8,166,645,000 | 3.55% |
| Total | 79,736 | $121,757,318,000 | $134,343,120,000 | 10.34% |
Analysis by suburbs – all property types
| Property type | Number of properties | 2021 CIV | 2022 CIV | CIV % change |
|---|---|---|---|---|
| Ashburton | 3,324 | $4,688,375,000 | $5,103,505,000 | 8.85% |
| Balwyn | 6,447 | $10,354,082,500 | $11,075,997,500 | 6.97% |
| Balwyn North | 8,316 | $13,651,982,500 | $15,482,805,000 | 13.41% |
| Camberwell | 10,322 | $16,588,740,000 | $18,727,030,000 | 12.89% |
| Canterbury | 3,437 | $7,658,670,000 | $8,189,295,000 | 6.93% |
| Deepdene | 1,002 | $2,028,800,000 | $2,153,555,000 | 6.15% |
| Glen Iris | 6,475 | $10,461,343,000 | $11,596,100,000 | 10.85% |
| Hawthorn | 13,576 | $16,543,757,500 | $18,148,072,500 | 9.70% |
| Hawthorn East | 8,504 | $10,620,440,000 | $11,535,902,500 | 8.62% |
| Kew | 11,592 | $19,340,757,500 | $21,391,702,500 | 10.60% |
| Kew East | 2,922 | $4,105,090,000 | $4,505,410,000 | 9.75% |
| Mont Albert | 59 | $124,475,000 | $135,225,000 | 8.64% |
| Surrey Hills | 3,760 | $5,590,805,000 | $6,298,520,000 | 12.66% |
| Total | 79,736 | $121,757,318,000 | $134,343,120,000 | 10.34% |
Pagination links
Operating and capital grants
Operating and capital grants
Operating grants
Operating grants from state and federal governments help us deliver services to ratepayers. Operating grants can be either:
- recurrent, meaning they are received each year
- non-recurrent, meaning they are once off or short term.
For 2022–23, we have budgeted a decrease to operating grant funding by 50.8% or $5.89 million, compared to the 2021–22 forecast. This is due to:
- $5.48 million decrease in recurrent operating grants. This is mainly because the Victorian Local Government Grants Commission (VLGGC) brought forward 75% or $3.93 million of the 2022–23 allocation to the 2021-22 financial year
- $413,000 decrease in non-recurrent operating grants This is mainly because of a reduction in COVID-19-related grant funding
- a partial offset with streetscape and transport grants, including $691,000 from the North East Link and $265,000 for the removal of the Union Road level crossing.
After adjusting for the Victorian Local Government Grants Commission, the total for operating grants is expected to decrease by 2.9%. The small decrease in operating grants and subsidies show that the trend of grant income is not keeping up with the spending required to deliver services to the community. As a result, there is an increasing financial burden on Council and our ratepayers.
Operating grants by type and source, classified into recurrent and non-recurrent
Capital grants
Capital grants from state and federal governments and community sources help us fund the Capital Works Program.
The amount of capital grants we receive each year can change a lot depending on the type of works in the Capital Works Program.
Capital grants can be either:
- recurrent, meaning they are received each year
- non-recurrent, meaning they are once off or short term.
For 2022–23, we have budgeted for capital grants funding to total $2.62 million. This is a decrease in capital grant funding of $13.31 million compared to 2021–22.
The largest grants for 2022–23 include:
- $1.19 million from the Commonwealth Government Local Roads and Community Infrastructure program
- $800,000 – the third instalment of $1.60 million for Canterbury Community Precinct from the Department of Education and Training Grant
- $593,811 from the Commonwealth Government Roads to Recovery Program covering roads pavement renewal works.
Capital grants by type and source, classified into recurrent and non-recurrent
Pagination links
Capital Works Program 2022–23
Capital Works Program 2022–23
Where Capital Works Program funding comes from
Our Capital Works Program totals $78.89 million. This is made up of:
- $43.34 million from Council operations (funded by rates)
- $2.62 million from external grants and contributions
- $19.70 million from borrowings
- $4.72 million from asset sales
- $8.51 million from Council cash (carried forward works from 2021–22).
How we will spend our Capital Works Program funding
The funding for each project is a forecasted amount for the 2022–23 year. The actual amount we spend could be more or less than this.
Capital Works Renewal Program
Renewal Program (New, Upgrade and Expansion)
Renewal Program (Property)
Renewal Program (Plant and equipment)
Renewal Program (Infrastructure)
Renewal Program (Major Projects - combined renewal, new, upgrade and expansion)
Renewal Program (Forward Commitments from 2021-22)
Summary of planned capital works expenditure
Downloads
Detailed list of capital works
The capital works projects are grouped by class and include:
- New works for 2022–23
- Works carried forward from the 2021–22 year.
New works for 2022–23
Budget Reports – Detailed list of Capital Works for the year ending 30 June 2023.
Detailed list of Capital Works (New Works)
Works carried forward from 2021–22
Budget Reports – Detailed list of Capital Works for the year ending 30 June 2023.
Detailed list of Capital Works (Works carried forward from the 2021-22 year)
Pagination links
Priority Projects
Priority Projects
Our Priority Projects program provides funding for short-term projects or pilot initiatives. This allows us to deliver on important issues for the community, while making sure that project funding doesn’t become part of the recurrent operating budget. It is another example of our commitment to financial sustainability, transparency and accountability.
In 2022–23, we have planned Priority Projects for the coming year and provided details for projects over the next 3 years.
The Priority Projects budget for 2022–23 includes projects that support all of our strategic objectives.
Our Priority Projects
Pagination links
Borrowings
Borrowings
Borrowings history
During the 2012–13 financial year, we borrowed $29 million to fund major building works. The borrowings were at a fixed interest rate for 10 years and we are due to pay this back in full in 2022–23. We are currently looking at our loan portfolio to see if there is an opportunity to refinance the rest of this loan for another 10 years.
In 2014–2015, we reviewed our existing loan portfolio and took the opportunity to refinance long-term debt to a 4-year loan. This provided decreased interest rates and interest savings to the community. It also provided increased financial capacity to support future infrastructure programs.
In 2021–22, we proposed to borrow $70 million to fund significant infrastructure projects, including works at Kew Recreation Centre and Canterbury Community Precinct.
Existing borrowings
During the 2021–22 year, we made $1.67 million in principal repayments on existing borrowings. This means that on 30 June 2022, our total borrowings will be $91.54 million. The projected cost of servicing these borrowings is $2.12 million during 2021–22.
Future borrowing strategy
Our borrowing strategy is to pay off existing debt over time so that we can look at new borrowings for significant infrastructure projects for the community. This strategy allows us to invest in new infrastructure while paying off our debts.
We will look at different borrowing strategies for each portion of planned borrowings as they become due.
Future proposed borrowings
The following table sets out our future proposed borrowings, based on our forecast position on 30 June 2022. The table also shows the results of financial ratios from the Victorian State Government. The years below cover our Long Term Financial Plan. For these years, we are projected to be at low risk as defined by the Victorian Auditor-General's Office financial sustainability risk indicator of indebtedness.
| Financial year ending | New borrowings | Principal paid | Interest expense | Balance 30 June |
|---|---|---|---|---|
| 2022 | $70,000,000 | $1,674,000 | $2,121,000 | $91,540,000 |
| 2023 | $19,700,000 | $26,362,000 | $2,781,000 | $84,877,000 |
| 2024 | – | $8,563,000 | $2,120,000 | $76,315,000 |
| 2025 | – | $8,803,000 | $1,876,000 | $67,512,000 |
| 2026 | – | $9,052,000 | $1,625,000 | $58,459,000 |
| 2027 | – | $8,773,000 | $1,390,000 | $49,686,000 |
| 2028 | – | $9,003,000 | $1,158,000 | $40,684,000 |
| 2029 | – | $9,240,000 | $920,000 | $31,443,000 |
| 2030 | – | $9,482,000 | $675,000 | $21,961,000 |
| 2031 | – | $9,731,000 | $423,000 | $12,231,000 |
| 2032 | – | $9,987,000 | $166,000 | $2,244,000 |
Adjusted Working Capital Ratio
We monitor our Adjusted Working Capital Ratio (current assets/current liabilities). This means we look at how much cash, or assets we have that we can convert into cash, within 12 months to pay back any amounts we owe to others during this time. We work to a capital ratio of 1.2 to 1. This tells us how many time we could pay the money we owe. This approach supports our goal of having enough cash to be able to pay the money we owe 1.2 times (or pay what we owe and still have money left over). If the ration falls below the target, our Long Term Financial Plan must show our future capacity to get back to the target level. This Budget has forecasted us to achieve this outcome by 2032.
Statement of borrowings
| Indicator | Forecast Actual 2021–22 | Budget 2022–23 |
|---|---|---|
| Total amount borrowed as at 30 June of the prior year | $23,214,000 | $91,539,000 |
| Total amount to be borrowed | $70,000,000 | $19,700,000 |
| Total amount projected to be redeemed | –$1,674,000 | –$26,362,000 |
| Amount of borrowings 30 June | $91,540,000 | $84,877,000 |
Pagination links
Leases in our community
Leases in our community
Lease of land
Under section 115 of the Local Government Act 2020, we have the power to lease any land to any person for a term of 50 years or less.
However, this is still subject to any other act and where section 116 of the Local Government Act 2020 applies. If we lease any land to any person subject to any exceptions, reservations, covenants and conditions, it must comply with this section.
We must include any proposal to lease land in a financial year in the budget, where the lease is for one year or more and:
- the rent for any period of the lease is $100,000 or more a year
- the current market rental value of the land is $100,000 or more a year
- for 10 years or more.
If we propose to lease land that is subject to subsection (3) and that was not included as a proposal in the budget, we must complete a community engagement process in line with our community engagement policy before entering into the lease.
The proposed community leases set out in the table are in line with our Council Assets – Leasing and Licensing Policy 2017 and our Boroondara Community Plan 2021–31.
Our in-house Senior Valuer provides us with market rental valuations. All rentals proposed to be charged are in line with our Council Assets – Leasing and Licensing Policy.
| Tenant | Proposed term | Permitted use | Annual Market Rental Valuation (excluding GST) |
Proposed Annual Rental (including GST) |
|---|---|---|---|---|
| Hawthorn Early Years Inc | 5 years | Long day care centre and associated purposes as agreed by Council. |
$403,000 | $1.00 |
| Goodstart Early Learning Ltd | 5 years | Long day care centre and associated purposes as agreed by Council. |
$265,200 | $1.00 |
| Greythorn Early Childhood Centre Inc | 5 years | Long day care centre and associated purposes as agreed by Council. |
$236,600 | $1.00 |
| Camberwell Kindergarten and Child Care Centre Inc | 5 years | Long day care centre and associated purposes as agreed by Council. |
$106,000 | $1.00 |