Annual Report 2022-23
Annual Report 2022-23
This Annual Report documents our performance within the 2022-23 financial year (FY2022-23).
It also details the allocation of resources, services, initiatives, and associated performance indicators, mapped to the 7 themes of the Boroondara Community Plan 2021-31. This allows us to track our progress against delivering the strategic objectives of the community plan. You can find out about the community plan on our Boroondara Community Plan 2021-31 page.
The online version of the Annual Report 2022–23 has been simplified and edited for the web.
Download the full Annual Report 2022-23
Table of contents
Fast facts about our services
Fast facts about our services
Learn some quick statistics on our service performance and our community's interaction with these services in FY2022-23.

309 arts and cultural community events delivered or supported
61,694 tonnes of materials collected from kerbside bins – 44,181 tonnes were diverted from landfill

54 sportsgrounds maintained
17,952 hours of support provided to older people to remain active in our community

4,843 children supported through our Maternal and Child Health services
2,069 new trees planted

20,342 young people attended youth programs or services

126 groups received Council community grants

2,329 volunteer referrals by the Boroondara Volunteer Resource Centre
Pagination links
Council snapshot
Council snapshot
Our vision represents our commitment to the community outlined in the Boroondara Community Plan 2021-31. You can find out more on our Boroondara Community Plan 2021-31 page.
Our purpose and values describe how we will work together to achieve our goals for the community.
Vision
A sustainable and inclusive community.
Purpose
We work together to deliver the community priorities and place our customers at the centre of everything we do.
Values
We will create a collaborative and customer-centric culture which connects our people to our purpose, inspires them to be their best, and provides a great place to work. You can see our 6 organisational values on the Our values page.
Our role as a council
The City of Boroondara is established through and governed by the Local Government Act 2020 and is committed to our community’s vision to create ‘a sustainable and inclusive community’ in Boroondara.
Planning
Working directly with the community to ensure community needs are anticipated and met, now and into the future.
Delivering
Directly delivering services, programs or facilities at the local level.
Partnering
Working collaboratively with residents, community groups, the State and Federal Governments and other stakeholders to facilitate desired outcomes and build community capacity.
Advocating
Taking into account the diverse needs of our community and representing community interests to influence industry, peak bodies and associations, and State and Federal government decision-making.
City profile
Boroondara has an estimated residential population of 169,411 people (as at 30 June 2022). Our residents were born in more than 150 countries and speak more than 120 languages. Within Boroondara we have one of the highest concentrations of schools of all Victorian local government areas.
You can find out more about the demographics of the City of Boroondara in the City of Boroondara Community Profile on the id Community website.
We have 53 shopping centres and strips, with the main shopping strips located at:
- Camberwell Junction
- Glenferrie Road
- Hawthorn
- Kew Junction.
A quarter of our residents earned $2,000 or more per week in 2021, and 19% of our residents are volunteers.
Council wards and councillors
The City of Boroondara's 11 Council wards in FY2022-23 are represented by individual councillors, each elected by members of the community for a 4-year term of office. Our wards and the FY2022-23 councillors representing them are:
- the Cotham Ward represented by Mayor and Cr Felicity Sinfield
- the Lynden Ward represented by Deputy Mayor and Cr Lisa Hollingsworth
- the Maranoa Ward represented by Cr Cynthia Watson
- the Junction Ward represented by Cr Di Gillies
- the Solway Ward represented by Cr Garry Thompson
- the Maling Ward represented by Cr Jane Addis
- the Bellevue Ward represented by Cr Jim Parke
- the Studley Ward represented by Cr Nick Stavrou
- the Riversdale Ward represented by Cr Susan Biggar
- the Gardiner Ward represented by Cr Victor Franco
- the Glenferrie Ward represented by Cr Wes Gault.
You can find out more about our current councillors and wards on our Mayor and councillors page.
Our organisational structure
Our Executive Leadership Team that leads the organisation includes our CEO, 4 directors and 3 senior leaders. The FY2022-23 Executive Leadership Team members are:
- Chief Executive Officer, Phillip Storer
- Director Community Support, Kate McCaughey
- Director Urban Living, Scott Walker
- Director Places and Spaces, Daniel Freer
- Director Customer and Transformation, Mans Bassi
- Executive Manager People, Culture and Development, Mary-Anne Palatsides
- Chief Financial Officer, Amy Montalti
- Manager Governance and Legal, Bryan Wee.
More information about our current Executive Leadership Team is available on our CEO and executive team page.
Pagination links
Our financials
Our financials
This is a summary of our performance for the FY2022-23. You can find more information in our Independent Auditor’s Reports of our Financial Report and Performance Statement in the Downloads section on this page.
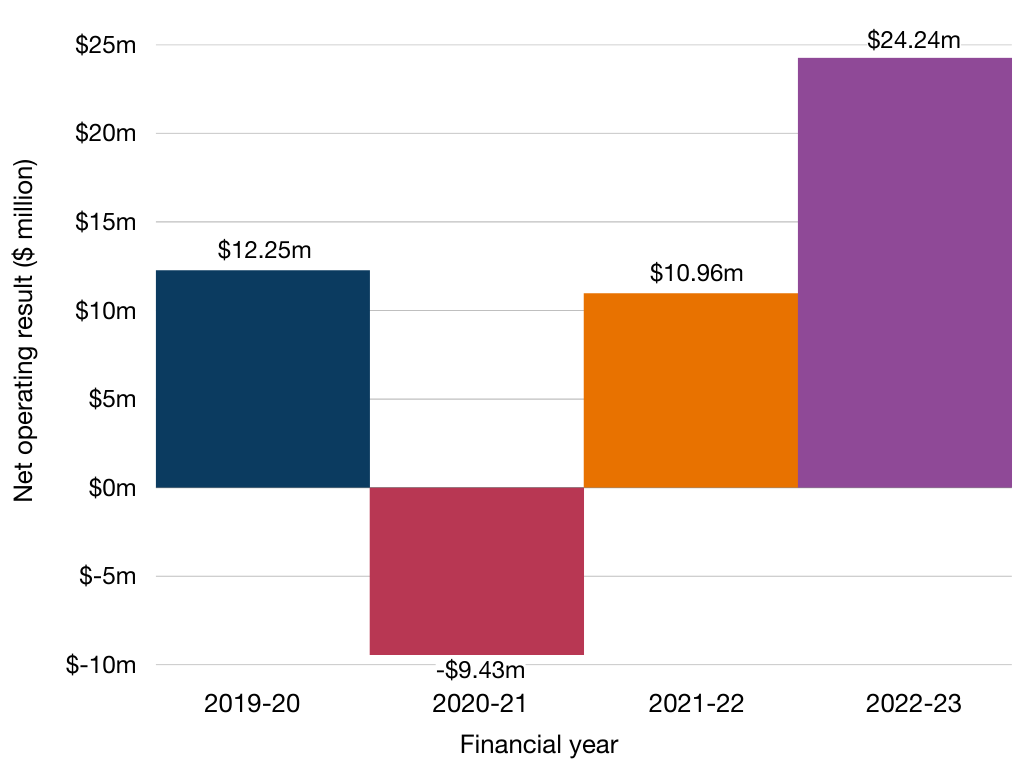
Operating position
Our net operating surplus for 2022-23 is $24.24 million. This surplus compares favourably to the original budget surplus of $6.61 million. The favourable variance is primarily due to the favourable impact of higher than anticipated interest rates, which generated a higher return on investment; unanticipated capital grants received and a required fair value adjustment resulting from a change in accounting policy on our investment properties. This favourable variance was partially offset by continued COVID-19 impacts on our leisure and aquatic facilities.
The adjusted underlying result – after removing non-recurrent capital grant income, monetary contributions and non-monetary asset contributions – is $8.9 million. The adjusted underlying result for 2022-23 has normalised due to the impacts of COVID-19 in 2021-22 and resulting impacts on revenue and expenditure streams.
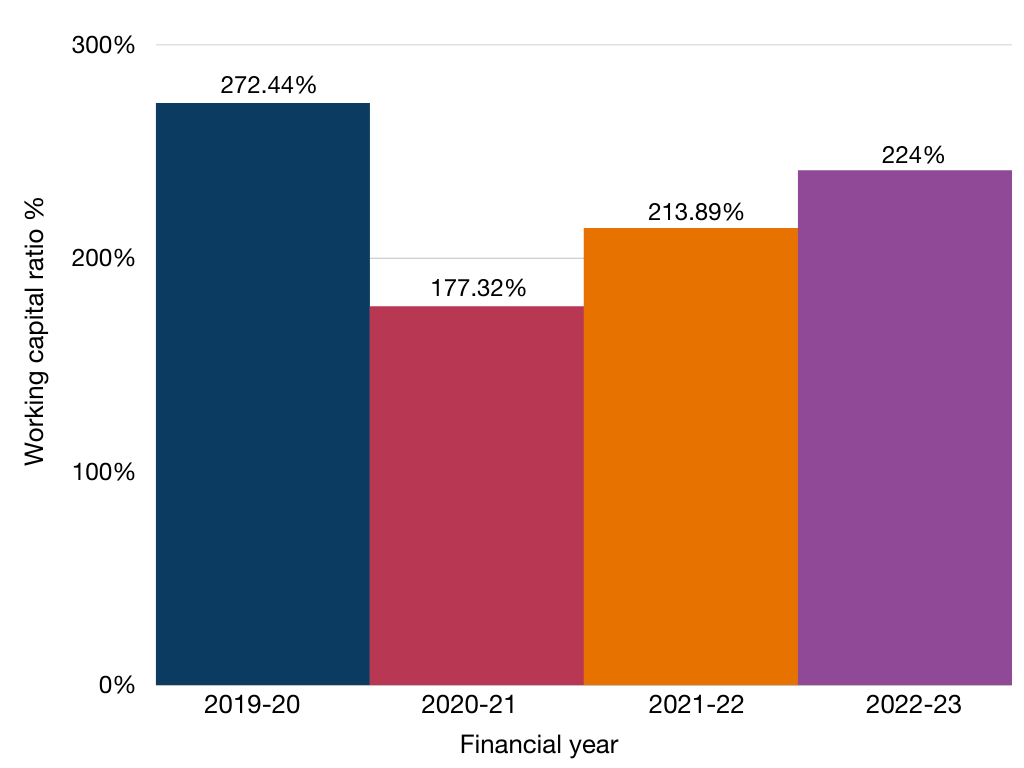
Liquidity
The working capital ratio, which assesses our ability to meet current commitments, is calculated by measuring our current assets as a percentage of current liabilities. Our result of 241% indicates a satisfactory financial position.
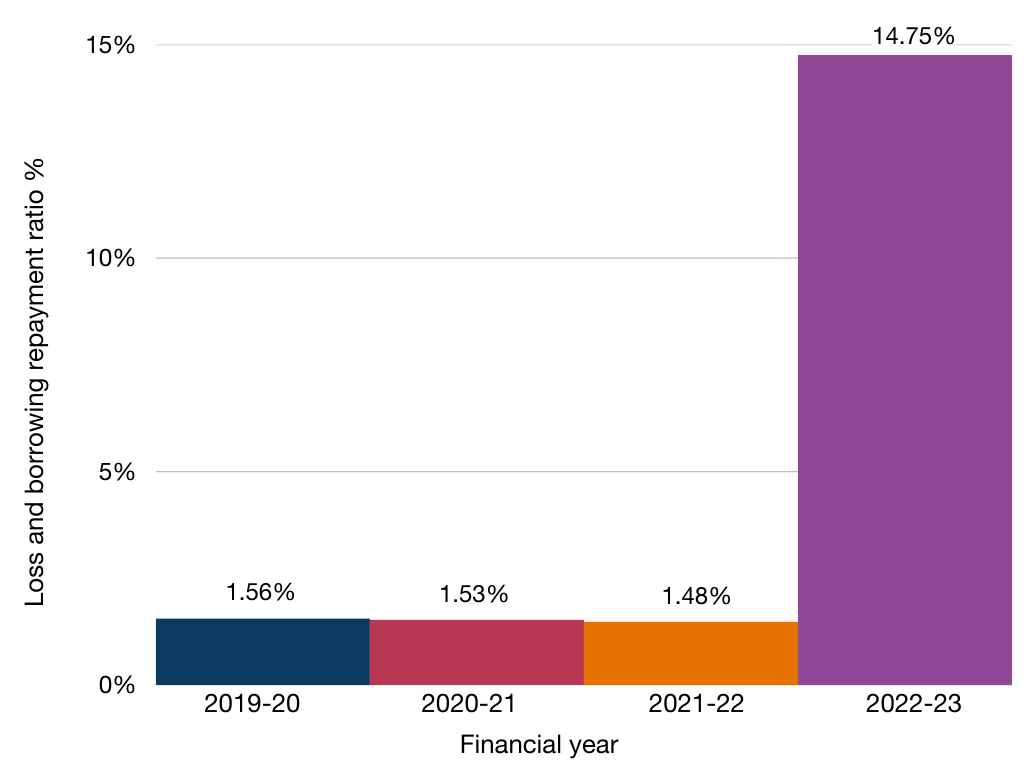
Obligations
We ensure that we maintain infrastructure assets at expected levels while continuing to deliver the services needed by the community. We invested $43.49 million in renewal works in 2022-23, including:
- the renewal of buildings ($17.47 million)
- roads ($10.27 million)
- drainage ($3.69 million).
This was funded from capital grants of $10 million and cash flow from operations of $33.49 million. At the end of 2022-23, our loans and borrowings repayment ratio – measured by comparing interest-bearing loans and borrowing repayments to rate revenue – was 14.75%. This increased significantly to the prior year’s value of 1.48%, which is reflective of the first full year of the repayment of the $70 million Treasury Corporation Victoria loan that was drawn in June 2022.
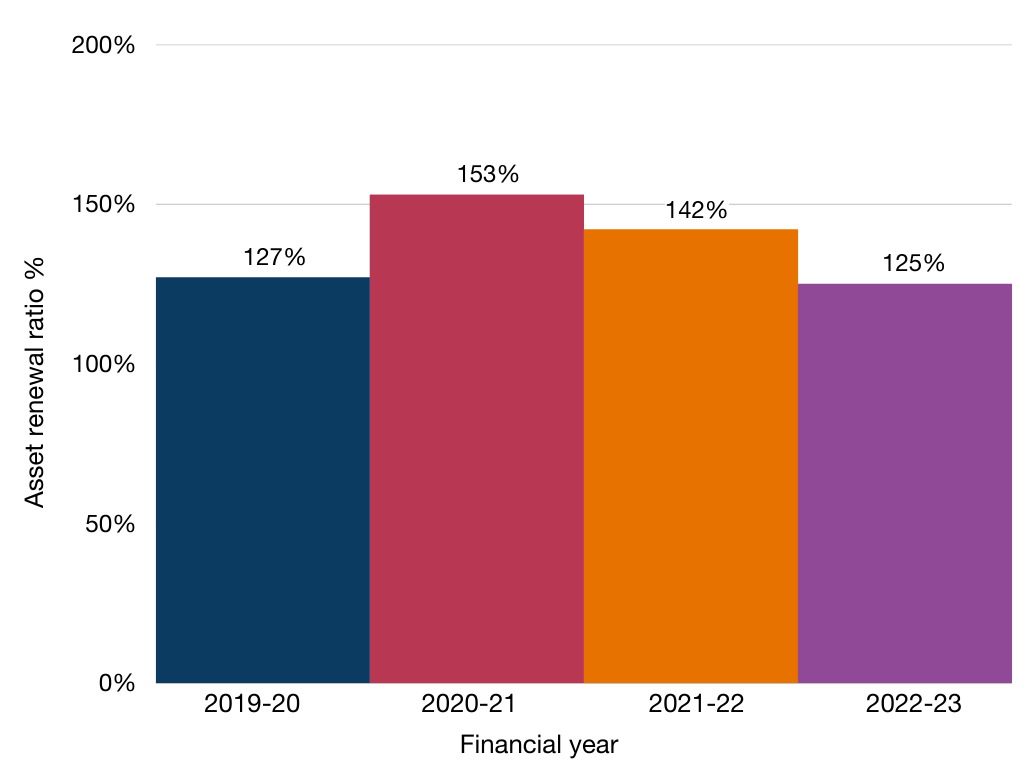
Asset renewal ratio is measured by comparing asset renewal and upgrade expenditure to depreciation, and was 125% in 2022-23. This is a slight decline on previous years due to a review of the timing of planned renewal projects, in the context of rising construction costs, resulting in some planned works being deferred to be undertaken in future years.
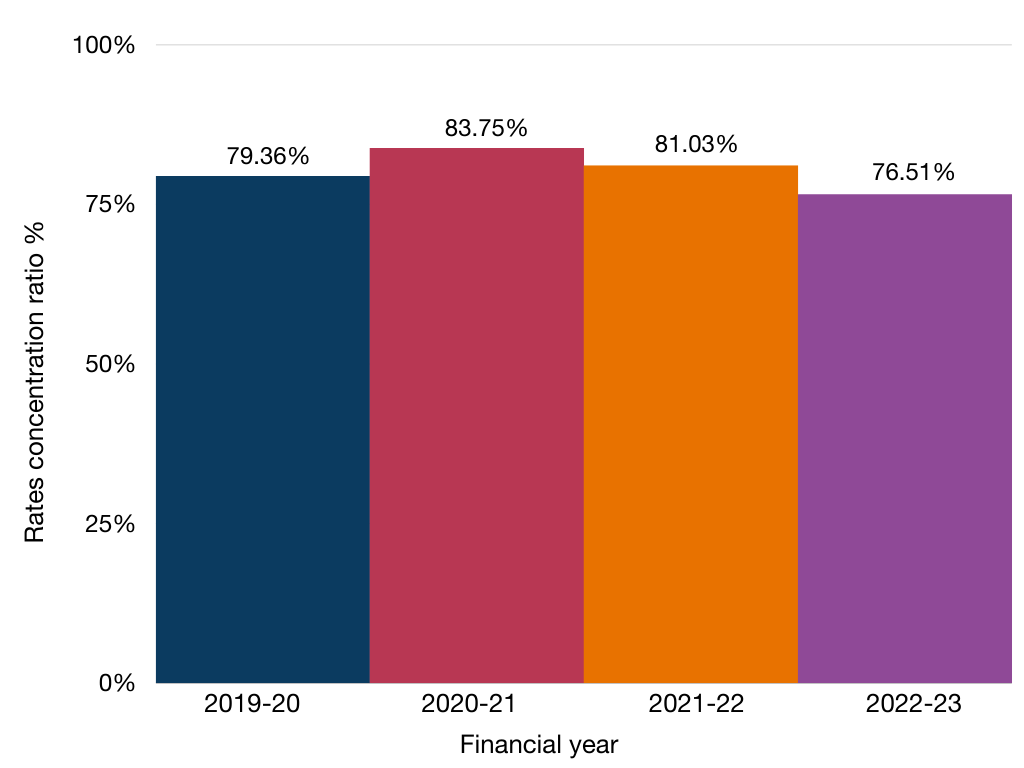
Stability and efficiency
We raise revenue from rates, user fees, fines, grants and contributions. Our rates concentration, which compares rate revenue to adjusted underlying revenue, was 76.51% for 2022-23. We are very reliant on rates as a source of revenue because of statutory restrictions on many fees and charges, and the inadequate increase in the payments from the Victorian Government to adequately fund services. In 2022-23, non-rate revenue has increased in proportion to rate revenue resulting in the decline of the rates concentration ratio due to the continued recovery of our non-rate revenue streams, which have been impacted by COVID-19 in prior years.
Read the Independent Auditor’s Reports of our Financial Report and Performance Statement
Pagination links
Operations and our performance
Operations and our performance
Economic factors
We are facing external factors which are increasing cost pressures on our services and facilities, while also facing the need to maintain assets appropriately. External economic factors include:
- inflation rising rapidly
- cost escalation in the construction industry
- the slow return by patrons to our leisure and aquatic facilities after the forced closure of these facilities during the COVID-19 pandemic
- the reduction of the traditional backyard across areas of the municipality increasing the demand by residents on our open space, parks, and sporting facilities.
The 2022-23 Budget is largely based on a recovery of normal activity levels post the COVID-19 pandemic. Our strong financial management resulting in a positive year-end result is critical in enabling us to address the ongoing requirement for asset renewal to ensure our facilities meet community needs and are fit for purpose.
Higher interest rates will support increased investment income returns for our cash holdings, while our fixed interest rate loans provide repayment certainty for the future term of the loans.
In summary, we are facing external factors which are increasing cost pressures on our services and facilities while facing the need to maintain assets appropriately. Our capacity to meet these obligations is challenged by the State Government imposed cap on revenue; a cap the state does not apply to itself.
Major projects
Our major projects for FY2022-23 included:
- Kew Recreation Centre redevelopment ($73.1 million over 4 years)
- Canterbury Community Precinct ($3.7 million in FY2022-23)
- Tuck Stand ($484.5k in FY2022-23)
- Kew Library Redevelopment ($164.2k in FY2022-23).
Our performance against priority themes
The Boroondara Community Plan 2021–31 (the Plan) outlines 7 themes our community told us were important in 2017. In 2020-21, our community told us these themes still represent what they want us to focus on over the next 10 years.
Our performance for FY2022-23 is reported against each of the 7 priority themes on the following pages.
Pagination links
Theme 1: Community, services and facilities
Theme 1: Community, services and facilities
Major achievement
Strategic objective
Community services and facilities are high quality, sustainable, inclusive and strengthen resilience.
Major initiative 1.6
Enhance the provision of early years education, disability and recreation services to the local community by completing the construction of the Canterbury Community Precinct and supporting the coordination of the community agencies on site to work together to optimise service provision.
New Canterbury Community Precinct project
The new Canterbury Community Precinct provides a central hub for community health, education and children’s services, which have previously been operating in various locations in Canterbury. Located in Canterbury Gardens, the precinct features a new main building, as well as renewed buildings. These include:
- the former Canterbury Maternal Child Health building
- the former Canterbury Bowls Club pavilion
- the former Canterbury Public Library.
The development of the Canterbury Community Precinct aims to:
- create a precinct which provides early years services and community programs for all ages in our community
- co-locate services in one convenient location to ensure the ongoing delivery of high-quality and easily accessible services for the community
- create a facility that complements and celebrates the local character and heritage of the area.
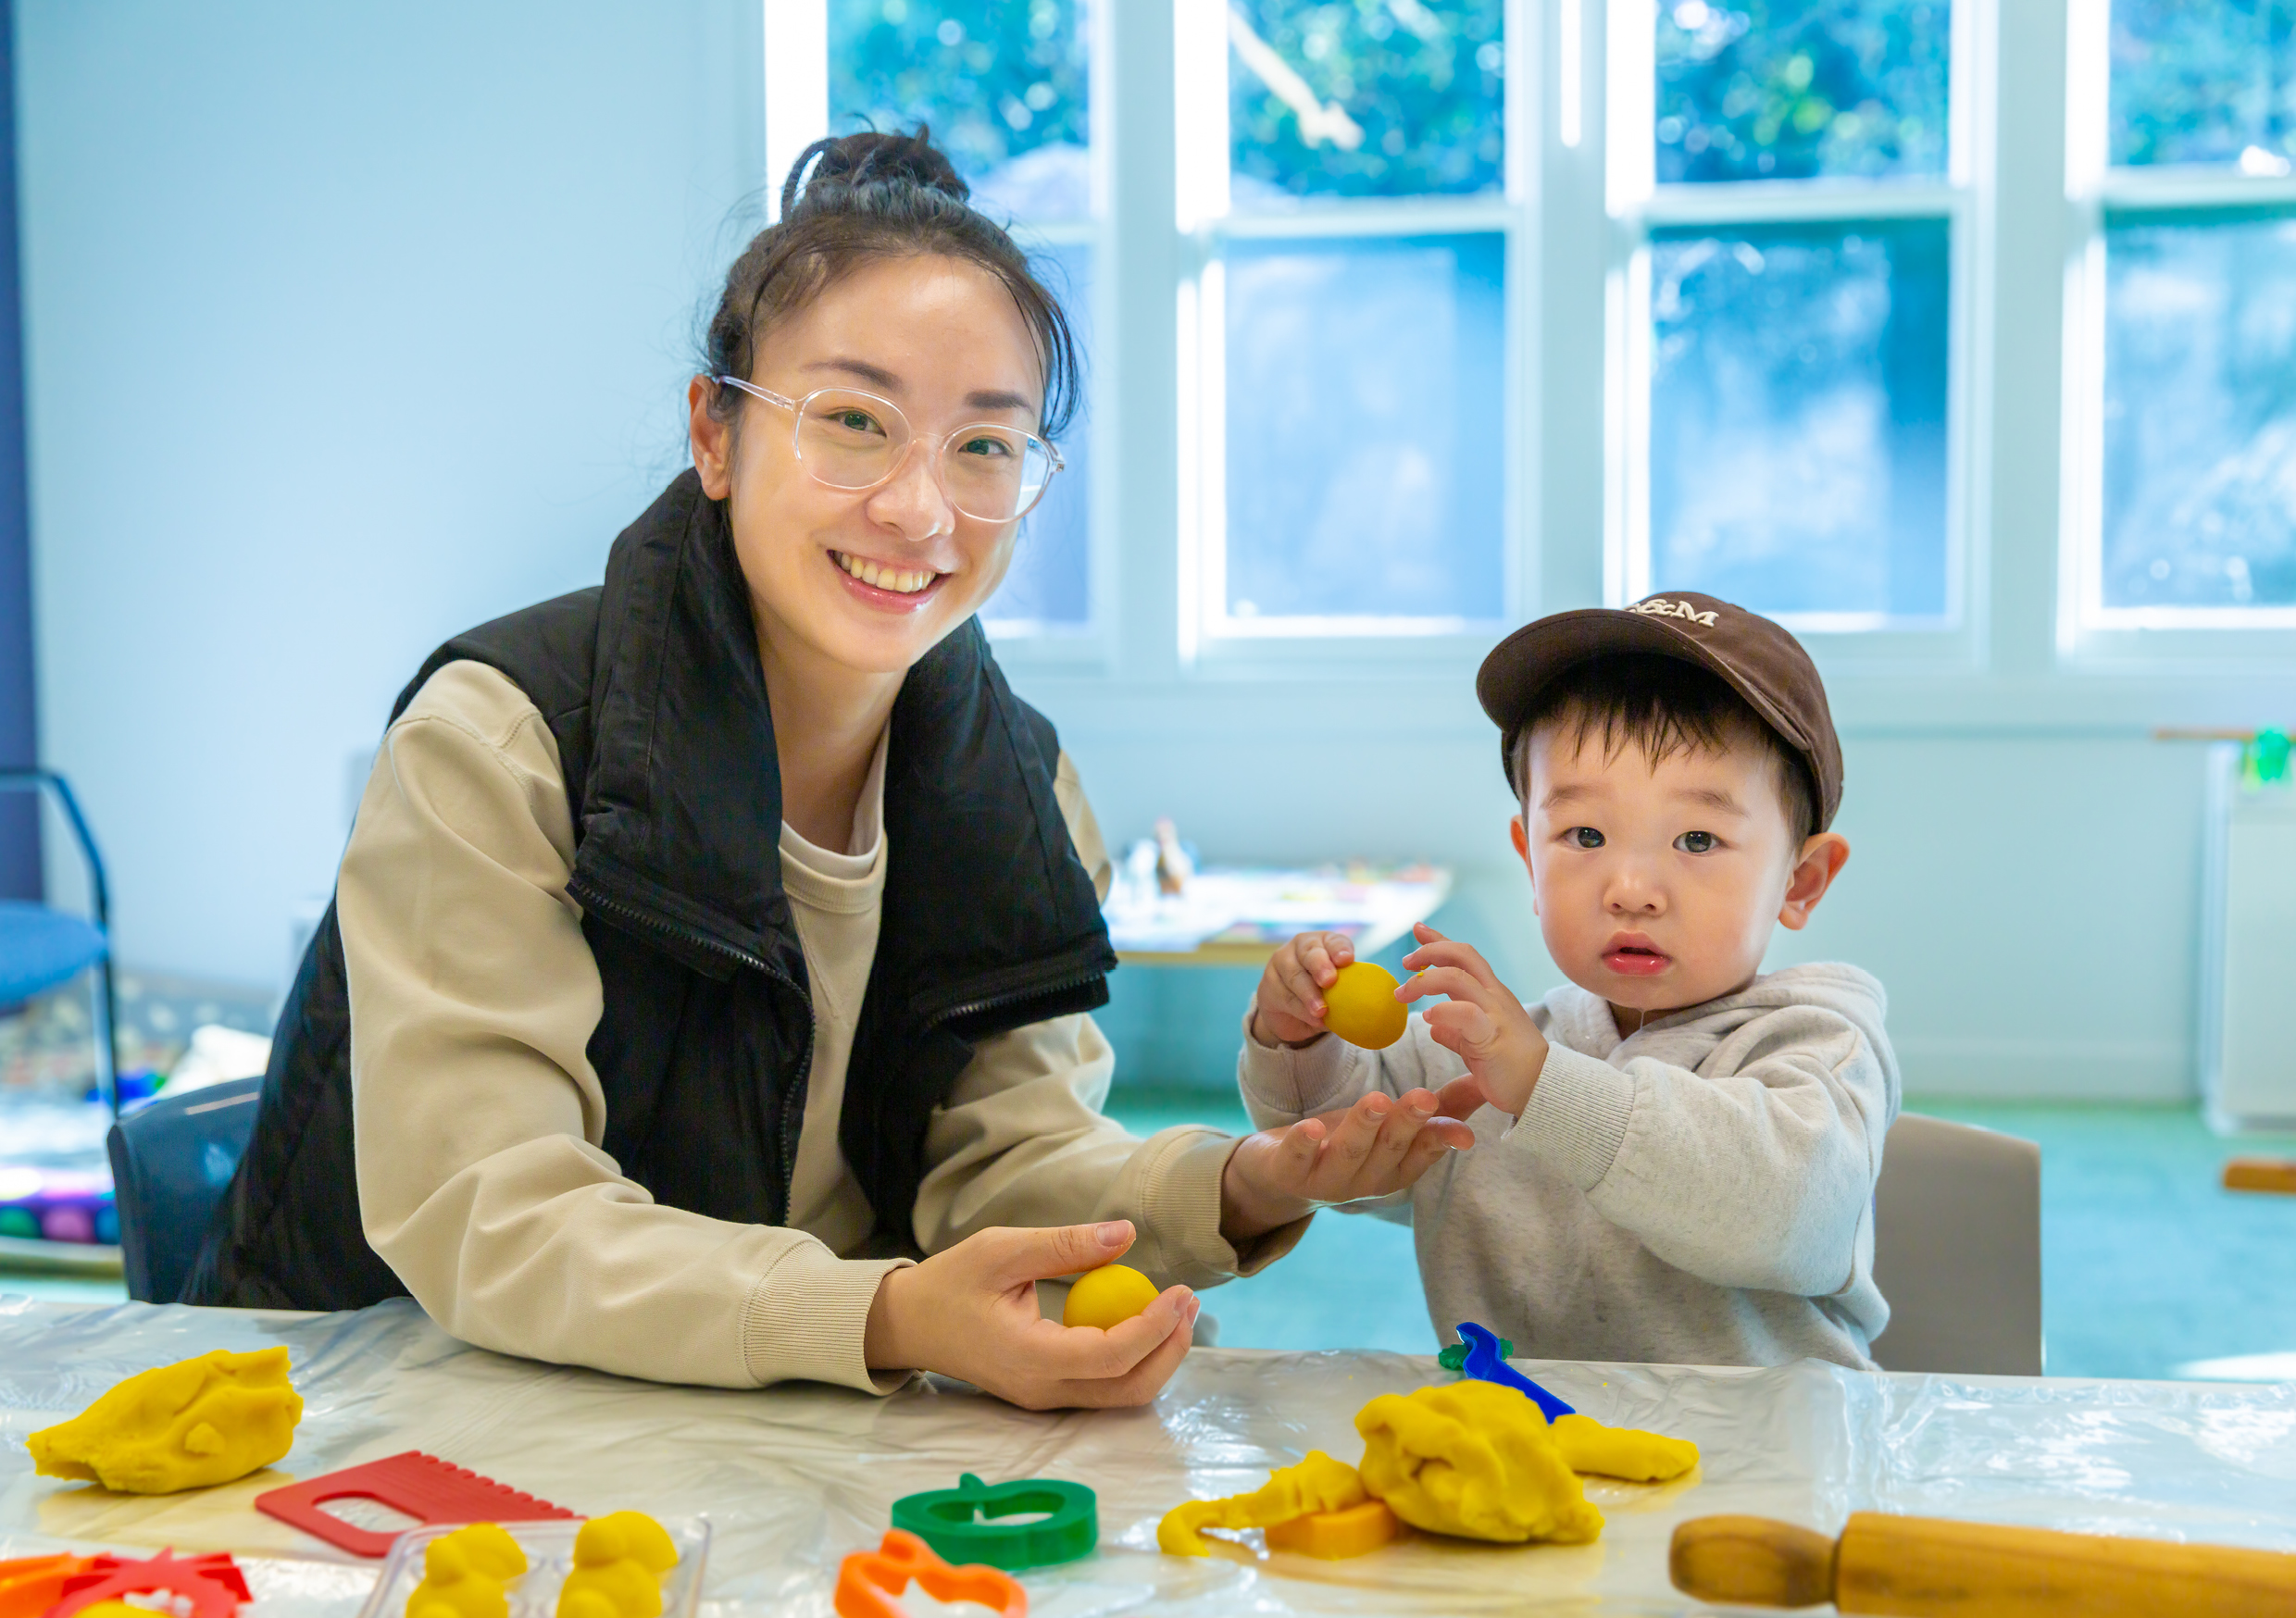
The new main building and the renewed former Canterbury Bowls Pavilion located on Kendall Street opened for community use in March 2023. The Canterbury Neighbourhood Centre, Canterbury Community Garden, Canterbury Maternal and Child Health Centre, Canterbury Gardens Kindergarten, Playstation Occasional Care, and the Canterbury Toy Library are now all operating on site.
The second stage of works are underway to refurbish the former Canterbury Maternal and Child Health Centre and the former Canterbury Public Library buildings. These buildings will be home to Interchange Inner East and the historical societies once works are completed in late 2023.
Theme 1 performance
This is a breakdown of the strategic indicators, progress of initiatives and other service performance indicators for this theme. You can find out more detail about these indicators in the full report.
You can also read through our continuous improvement initiatives, community engagement, and benchmarking activities for this theme in the full report.
Strategic indicators
In almost all cases our strategic indicators saw consistent or improved results in FY2022-23. The strategic indicators that met or exceeded the forecast include the following.
Audience satisfaction with Boroondara Arts curated programs and events
Forecast: 70% to 75%
2022-23 result: 93%
Number of attendances by young people at youth programs or services
Forecast: 4,000 to 4,700
2022-23 result: 20,342
Number of people participating in active ageing programs and events
Forecast: 1,000 to 1,200
2022-23 result: 1,221
Number of community groups using council facilities directly under a lease or license agreement
Forecast: 190
2022-23 result: 190
Number of community organisations funded through the Community Strengthening Grant Program
Forecast: 175 to 178
2022-23 result: 198
Number of arts and cultural community events delivered or supported by Council
Forecast: 100 to 190
2022-23 result: 309
Overall participation in library services (including loans, returns, visits, program attendances, e-books and audio loans, enquiries, reservations, wi-fi and virtual visits)
Forecast: 5,000,000 to 5,700,000
2022-23 result: 7,308,642
Percentage of community strengthening grants provided to culturally and linguistically diverse and disability groups
Forecast: 17% to 18%
2022-23 result: 11%
Food safety assessments (percentage of registered class 1 food premises and class 2 food premises that receive an annual food safety assessment)
Forecast: 100%
2022-23 result: 100%
Some indicators did not meet our forecast this year:
Number of vaccinations administered
Forecast: 21,432
2022-23 result: 18,804
The number of vaccines administered in FY2022-23 is lower due to a change in the National Immunisation Program, reducing the number of vaccine dosages for Year 7s.
Satisfaction with recreational facilities
Forecast: 79 to 81
2022-23 result: 72
Recreational facilities remain as one of our top 3 performing areas in the Customer Satisfaction Survey. There was a decline in this rating across the state, and we remain on par with metro (68) and significantly above state-wide (68) averages.
Percentage of graffiti removed from Council owned assets within one business day of notification
Forecast: 100%
2022-23 result: 98%
The target was not met due to some jobs requiring safety access equipment and taking longer than expected to complete graffiti removal. Quarter 4 was also subject to wet weather conditions which delayed removals.
Percentage of community strengthening grants provided to culturally and linguistically diverse and disability groups.
Forecast: 17% to 18%
2022-23 result: 11%
In 2022, fewer community grant applications were received from all groups due to the backlog of funded activities paused during the COVID-19 pandemic.
Progress of initiatives in the Budget
Initiatives that were completed in FY2022-23:
- Inform our planning and strategic direction to align its delivery of services to meet community needs by undertaking an analysis of the 2021 ABS data to identify current and projected changes in our population.
- Support older people to understand and navigate the Aged Care system by hosting information sessions and providing written and digital information on My Aged Care and commonwealth funded aged care services.
- Connect people living with a disability in Boroondara to physical activity opportunities by developing a Disability Sports Hub in collaboration with Disability Sport and Recreation (DSR) and the YMCA.
- Enrich and empower the community by providing high quality community-focused library collections, programs, facilities, and services through implementation of the 2022-23 actions from the Boroondara Library Action Plan 2020-2025.
- Support Local Historical societies to boost community access to their collections, which includes support to develop a model of operation at the Canterbury Community Precinct.
Initiatives that commenced in FY2022-23:
- Consider the needs and aspirations of people with a disability identified through community consultation by presenting a draft of the Boroondara Disability Action Plan 2023-27 to our councillors – 90% complete. People with disability, their families, and carers, as well as community groups and organisations that support and advocate for people with disability were consulted to understand the needs and aspirations of people with disability. Key elements of the draft Plan were presented to the Boroondara Community Disability Advisory Committee at its meetings for feedback. Officers are reviewing and incorporating feedback into the draft Plan, which will be presented to our councillors for endorsement for public exhibition in the first half of 2023-24. The draft Plan will guide our efforts to improve the experience of people with disability living, working, studying and visiting Boroondara. It provides a four-year vision and a two-year implementation plan for delivering actions. A new implementation plan will be developed at the end of 2025
- Create an all-ability recreation facility to meet current and future community needs by completing the construction of the Kew Recreation Centre – 50% complete. Construction of Kew Recreation Centre has been delayed due to the collapse of a section of the roof structure. Due to ongoing investigation and remediation activities, the project is reported as reduced progress to reflect deconstruction works.
- Enhance the provision of early years education, disability and recreation services to the local community by completing the construction of the Canterbury Community Precinct and supporting the coordination of the community agencies on site to work together to optimise service provision – 90% complete. Construction of Canterbury Community Centre Stage 1 is complete and open to the community for use. Stage 2 works commenced mid-April 2023 and are due for completion mid-late 2023.
- Make precincts easier to navigate and improve the consistency, readability, placement, and accessibility of signage by developing and adopting a Signage Strategy that outlines the style and use of signs that support facilities – 40% complete. At the start of the review of the Signage Style Guide, we found that the current City of Boroondara logo was not accessible and therefore non-compliant with the WCAG 2.0 legislative guidelines. This introduced additional scope to review as a critical input to the Signage Style Guide. The outcome of the review triggered a new project that involved a refresh of the logo, strapline and colour palette. This refreshed logo will now be applied in the Signage Style Guide, which will be delivered by December 2023.
Other service performance indicators
The following other service performance indicators and measures are based on the FY2022-23, unless stated otherwise. For more detail, including supporting commentary and how these results were calculated, see the full annual report PDF.
Animal management
Animals reclaimed
FY2022-23: 67%
FY2021-22: 68%
Animals rehomed
FY2022-23: 54%
FY2021-22: 17%
Animal management prosecutions
FY2022-23: 100%
FY2021-22: 100%
Cost of animal management service
FY2022-23: $8.57 per municipal population member
FY2021-22: $7.89 per municipal population member
Time taken to action animal management requests
FY2022-23: 1 day
FY2021-22: 1.16 days
Aquatic facilities
Cost of aquatic facilities
FY2022-23: -$0.03 per visit
FY2021-22: $0.88 per visit
Health inspections of aquatic facilities
FY2022-23: 1 health inspection
FY2021-22: 1 health inspection
Utilisation of aquatic facilities
FY2022-23: 14 visits per head of municipal population
FY2021-22: 8 visits per head of municipal population
Food safety
Food safety assessments completed
FY2022-23: 100%
FY2021-22: 100%
Time taken to action food complaints
FY2022-23: 1.7 days
FY2021-22: 1.4 days
Cost of food safety service
FY2022-23: $299 per registered or notified food premises
FY2021-22: $318 per registered or notified food premises
Critical and major non-compliance outcome notifications followed up
FY2022-23: 98%
FY2021-22: 93%
Maternal and Child Health (MCH)
Cost of the MCH service
FY2022-23: $79.12 per hour of service delivered
FY2021-22: $75.27 per hour of service delivered
Participation in the MCH service
FY2022-23: 83%
FY2021-22: 81%
Infant enrolments in MCH service
FY2022-23: 101%
FY2021-22: 101%
Participation in the MCH service by Aboriginal children
FY2022-23: 90%
FY2021-22: 93%
Participation in 4-week Key age and stage (KAS) visits
FY2022-23: 100%
FY2021-22: 102%
Libraries
Active library borrowers in municipality
FY2022-23: 20%
FY2021-22: 21%
Cost of library service per population member
FY2022-23: $56
FY2021-22: $50
Physical library collection usage
FY2022-23: 4 loans per physical library collection item
FY2021-22: 3 loans per physical library collection item
Recently purchased library collection (last 5 years)
FY2022-23: 64%
FY2021-22: 63%
Pagination links
Theme 2: Parks and green spaces
Theme 2: Parks and green spaces
Major achievement
Strategic objective
Green and open spaces are provided, well-utilised and enhanced.
Major initiative 2.1
Improve the sporting experience in Boroondara by setting and meeting service standards for all turf sports areas.
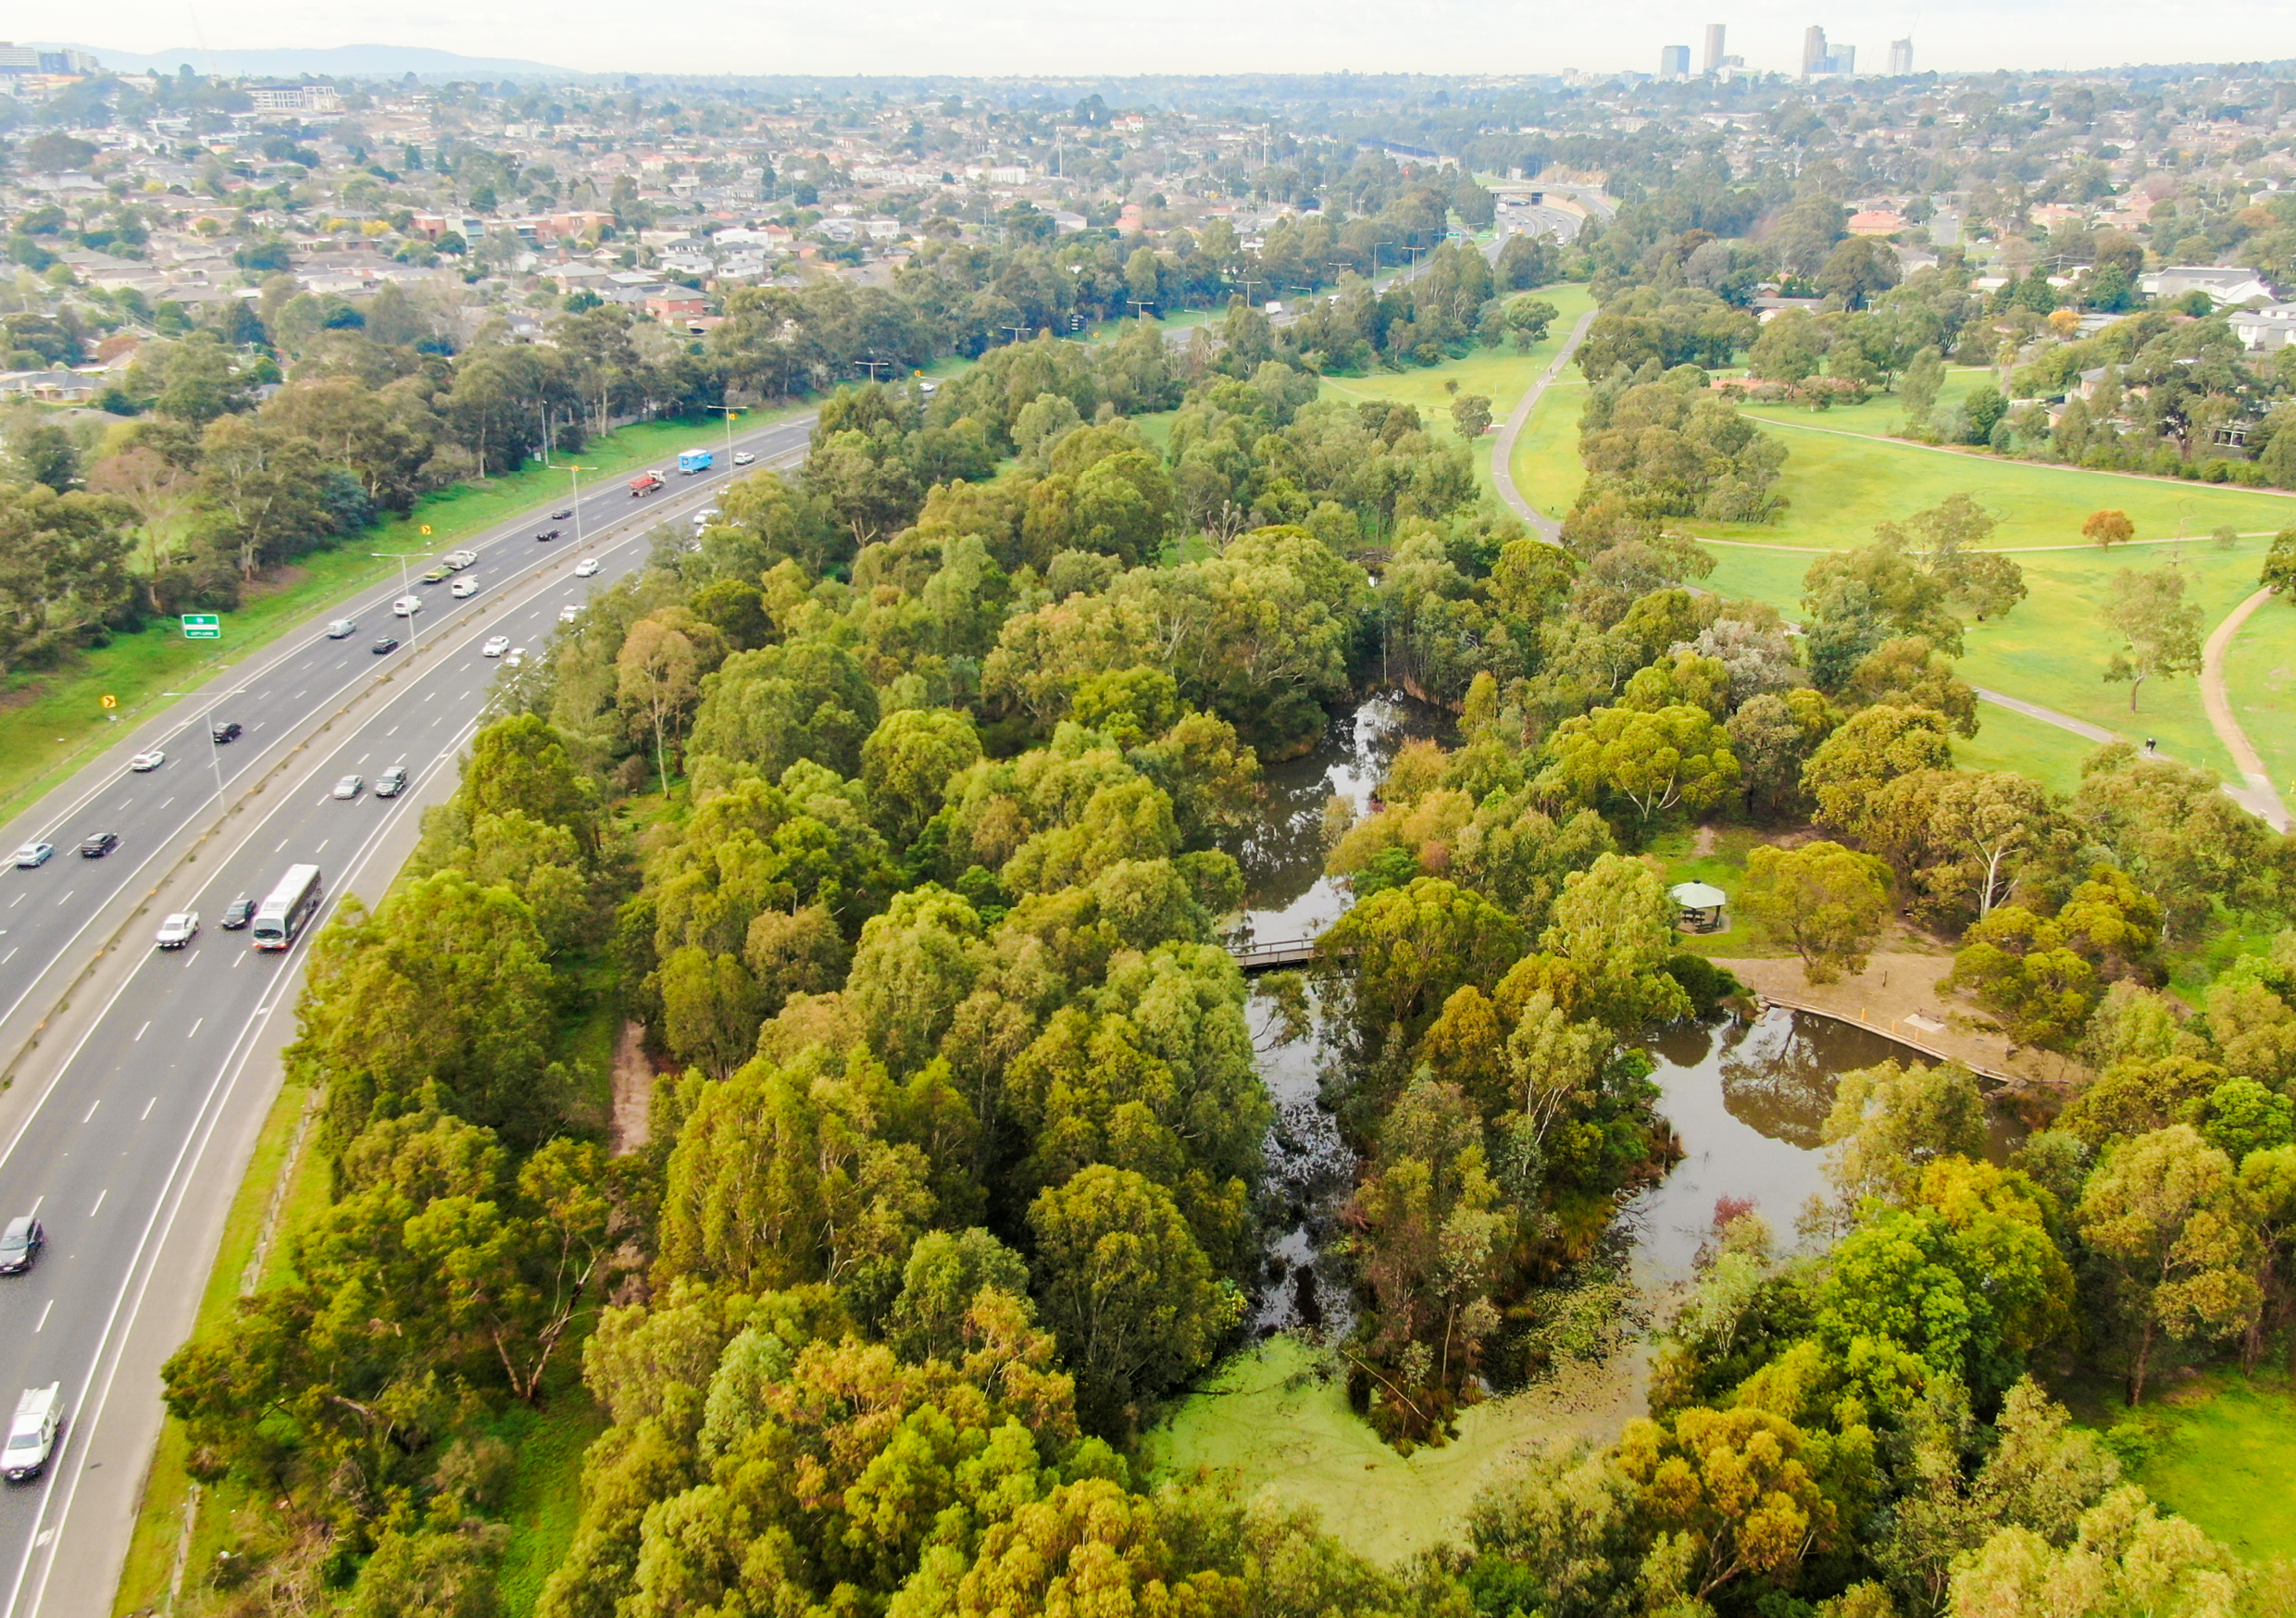
Freeway Golf Course redevelopment project
Freeway Golf Course is a premier public access golf facility located in Balwyn North. It is owned by the City of Boroondara and managed by our new operating partners, GreenSpace Management.
In FY2022-23, we completed a significant redevelopment of the Freeway Golf Course. We needed to reconfigure the course within a smaller footprint of land due to the North East Link Program acquisition of land from the course to build the new North East Link ramps.
Our community shared feedback to inform the new course design which was developed by leading golf architects Pacific Coast Design in collaboration with our officers. A strong focus was placed on environmental sustainability and biodiversity.
We aimed to:
- deliver a high quality, enjoyable 18-hole championship golf course experience for players
- ensure safety issues were addressed
- provide several access points to the clubhouse, car park and amenities
- maximise course distance despite the loss of land
- minimise impacts to the native flora and fauna and improve biodiversity by planting extra trees and understorey vegetation.
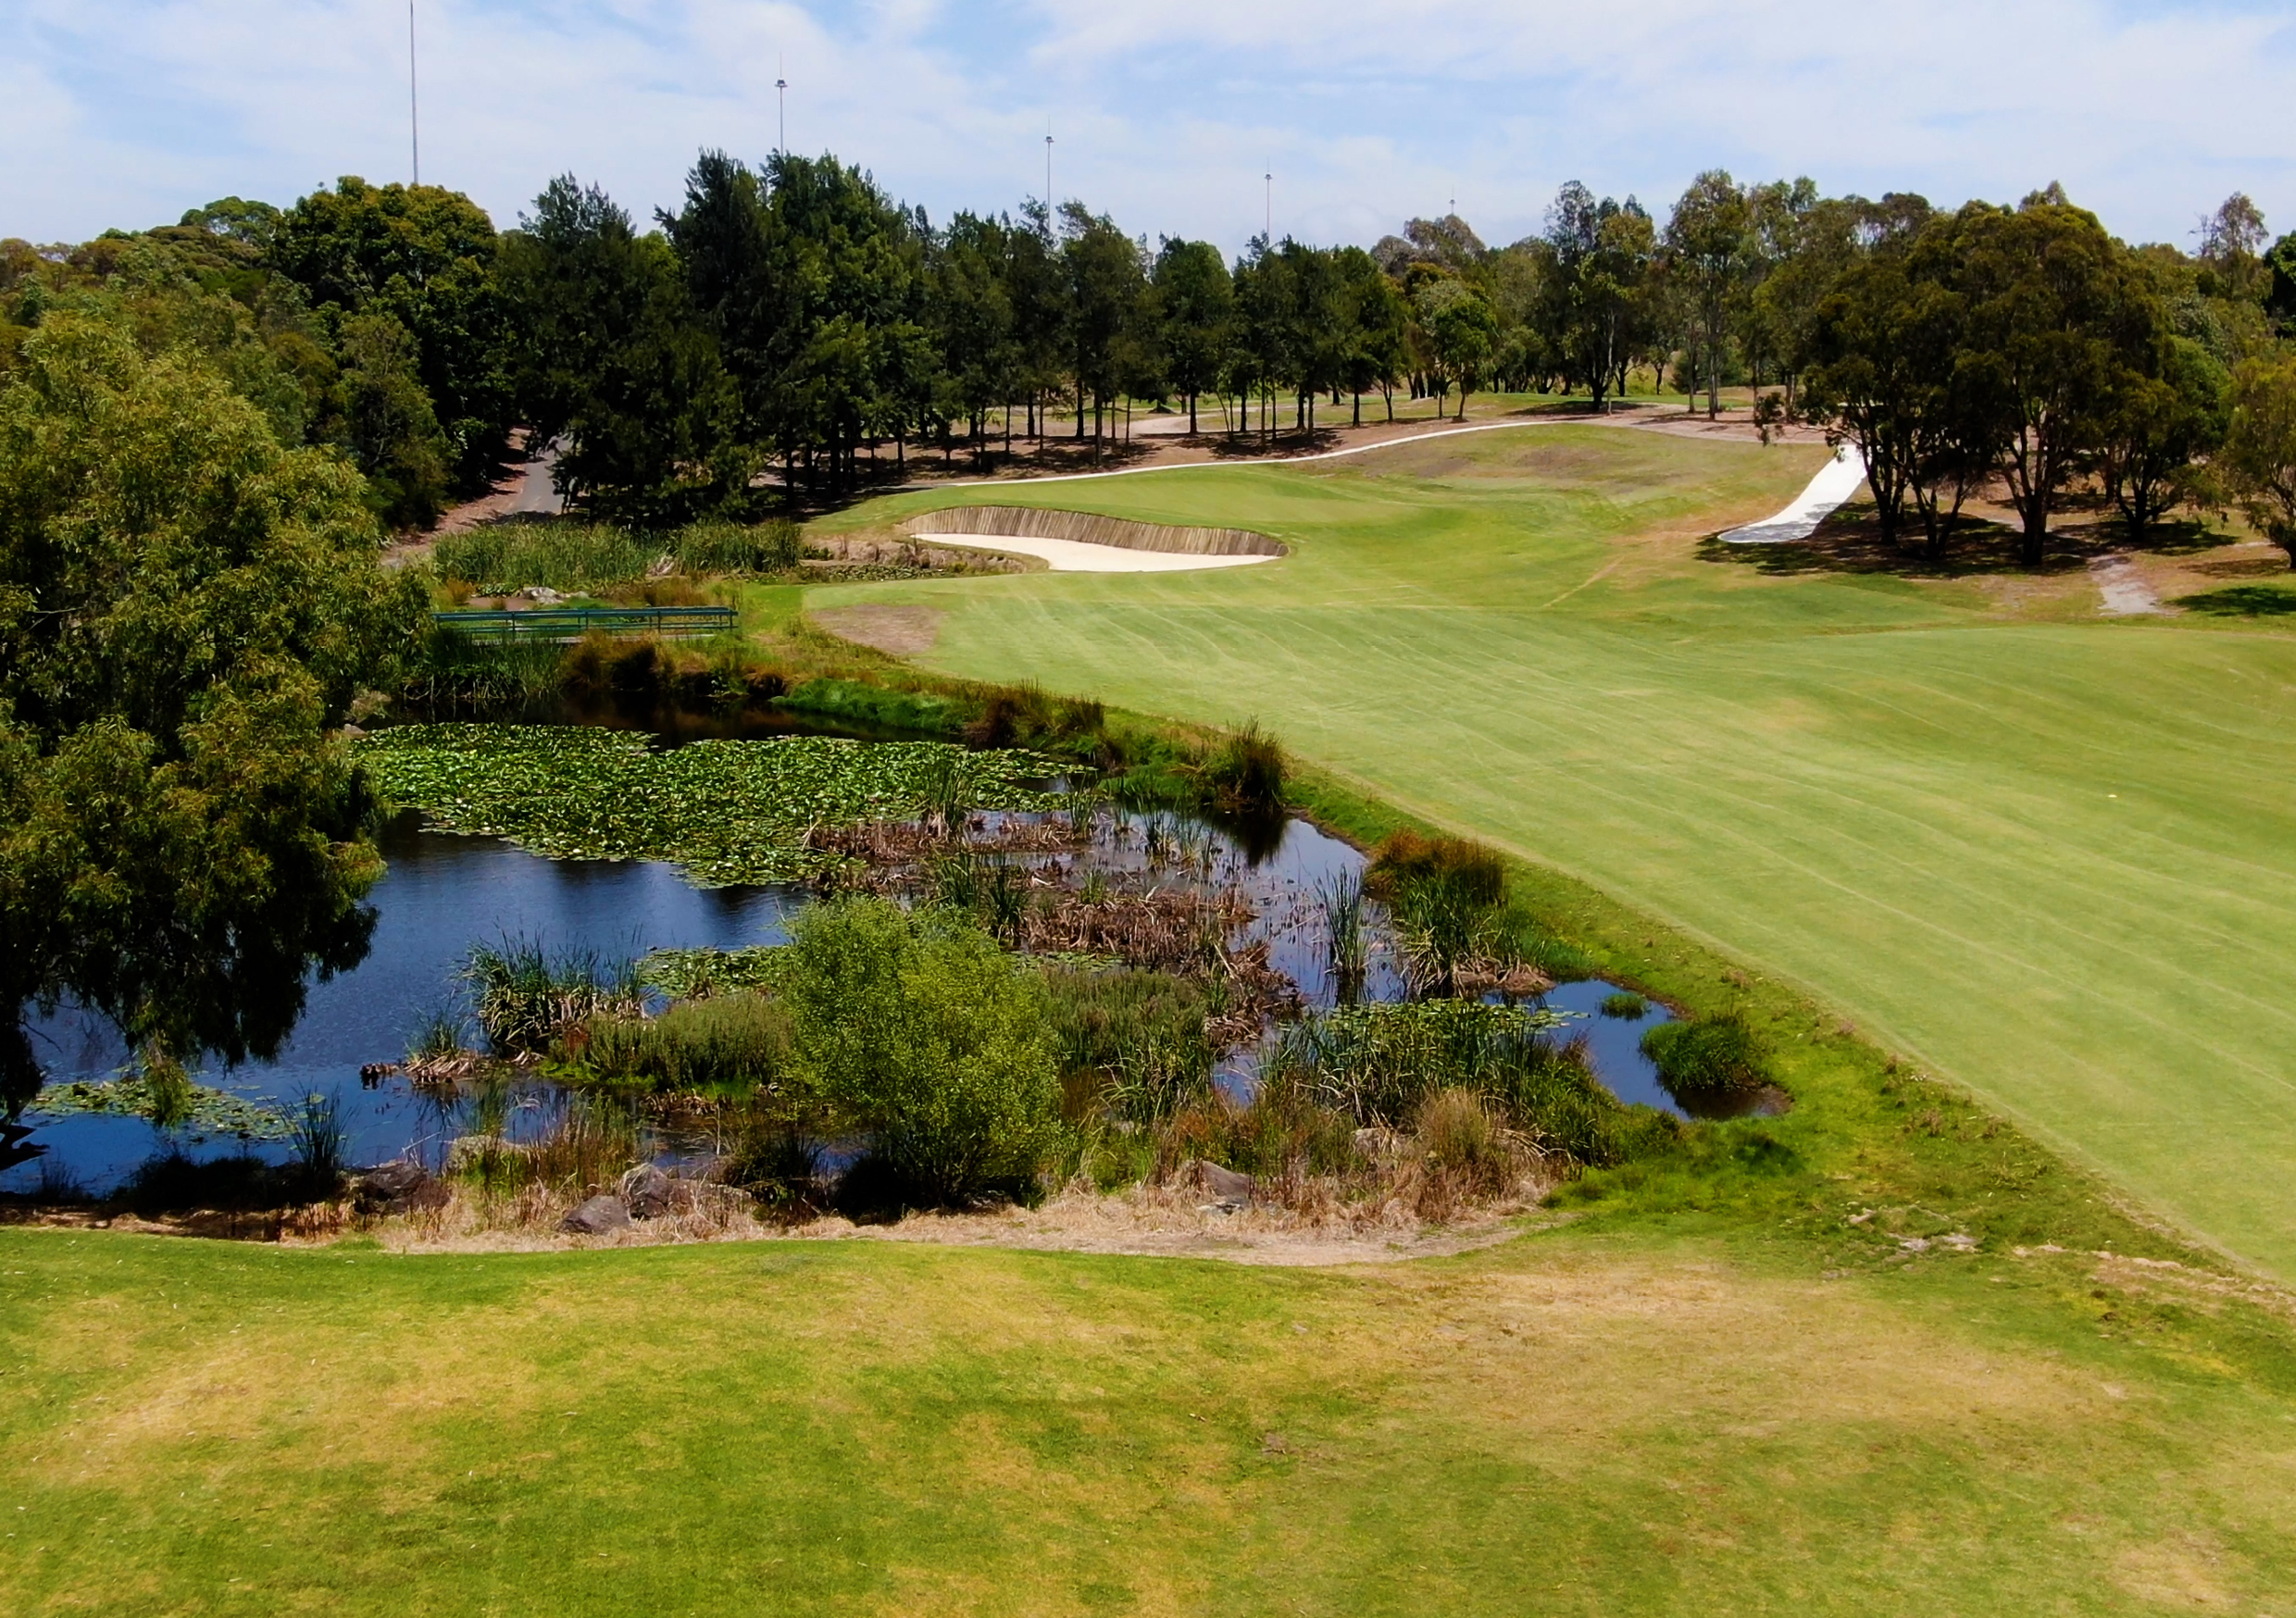
The redevelopment took place between late-2021 and early-2023. The new course officially reopened in March 2023. Key features include:
- a reconfigured 4,694-metre course
- a new practice putting green which has increased in size by 35%
- 3.1 hectares of new turf
- new timber-faced bunkers
- 5,000 new native plants
- 104 new native trees
- 2.8 kilometres of new pathways, including some sections of porous lane made up of 60% recycled tyres.
Usage levels of the new course have far exceeded expectations and we have received positive feedback from our community since its reopening.
Theme 2 performance
This is a breakdown of the strategic indicators, progress of initiatives and other service performance indicators for this theme. You can find out more detail about these indicators and previous year’s results in the full report.
You can also read through our continuous improvement initiatives, community engagement, and benchmarking activities for this theme in the full report.
Strategic indicators
There were only 3 strategic indicators for this theme in FY2022-23.
Two of these strategic indicators met or exceeded the forecast, and these were:
- the number of trees on Council managed land (forecast: 111,100 to 112,000, 2022-23 result: 115,762)
- user satisfaction with a range of parks in Boroondara, benchmarked with participating councils (forecast: 80 to 82, 2022-23 result: 80).
An indicator that did not meet our forecast this year was satisfaction with appearance of public areas (forecast: 80% to 82%, 2022-23 result: 72%). The appearance of public areas remains one of our top 3 performing areas in the Customer Satisfaction Survey. The result has reduced by 7 points in 2023, however, we are still performing higher than the benchmark of metro (68) and state (67) levels.
Progress of initiatives in the Budget
Initiatives that were completed in FY2022-23:
- Improve the sporting experience in Boroondara by setting and meeting service standards for all turf sports areas.
- Improve the community access and experience in parks by implementing new grass management practices and proactively managing mowing contracts.
- Provide family-friendly local community opportunities for enjoyment and social connection via the delivery of the 2023 Summer in the Park series showcasing cinema, music and theatre performances.
- Improve the health of the Boroondara community, by working with the YMCA to support programming of physical activity opportunities in Boroondara’s parks and sports grounds.
The one initiative for this theme that commenced in FY2022-23 and is 95% complete was enhancing recreational opportunities for children and families by commencing construction of the play space at Hays Paddock and completing construction of the play spaces at Grovedale and Kate Campbell. The Hays Paddock Playground contract has been awarded, with construction planned to commence mid-2023. The Grovedale Playground is 95% complete, with the final swing to be installed mid-July. The Mary MacKillop Playground construction works are underway, with a minor delay caused by a re-design to protect tree roots uncovered during demolition. Works are anticipated to be completed in late August 2023.
Pagination links
Theme 3: The environment
Theme 3: The environment
Major achievement
Strategic objective
The environment is considered in all decision making.
Major initiative 3.5
Protect Gardiners Creek now and into the future through the development and adoption of a master plan for Gardiners Creek, considering recreational, active transport, biodiversity, and environmental initiatives.
Gardiners Creek Master Plan
Gardiners Creek is a significant urban green corridor in Boroondara spanning the suburbs of Hawthorn, Hawthorn East, Glen Iris and Ashburton. Many public spaces run alongside the creek in our local area.
To ensure Gardiners Creek continues to be protected, cared for, and enhanced for future generations to enjoy, we’ve developed a master plan to guide planning in the area over the next 10 years. The master plan was shaped through extensive research and community consultation to balance the needs of Gardiners Creek’s various users.
Our vision is to create a more sustainable, cleaner and safer Gardiners Creek catchment by:
- improving the entry points, access and safety
- enhancing the rich and biodiverse area
- managing water and drainage with careful urban design
- improving water quality
- improving signage and how people get around the area
- recognising and celebrating Aboriginal histories and cultures.
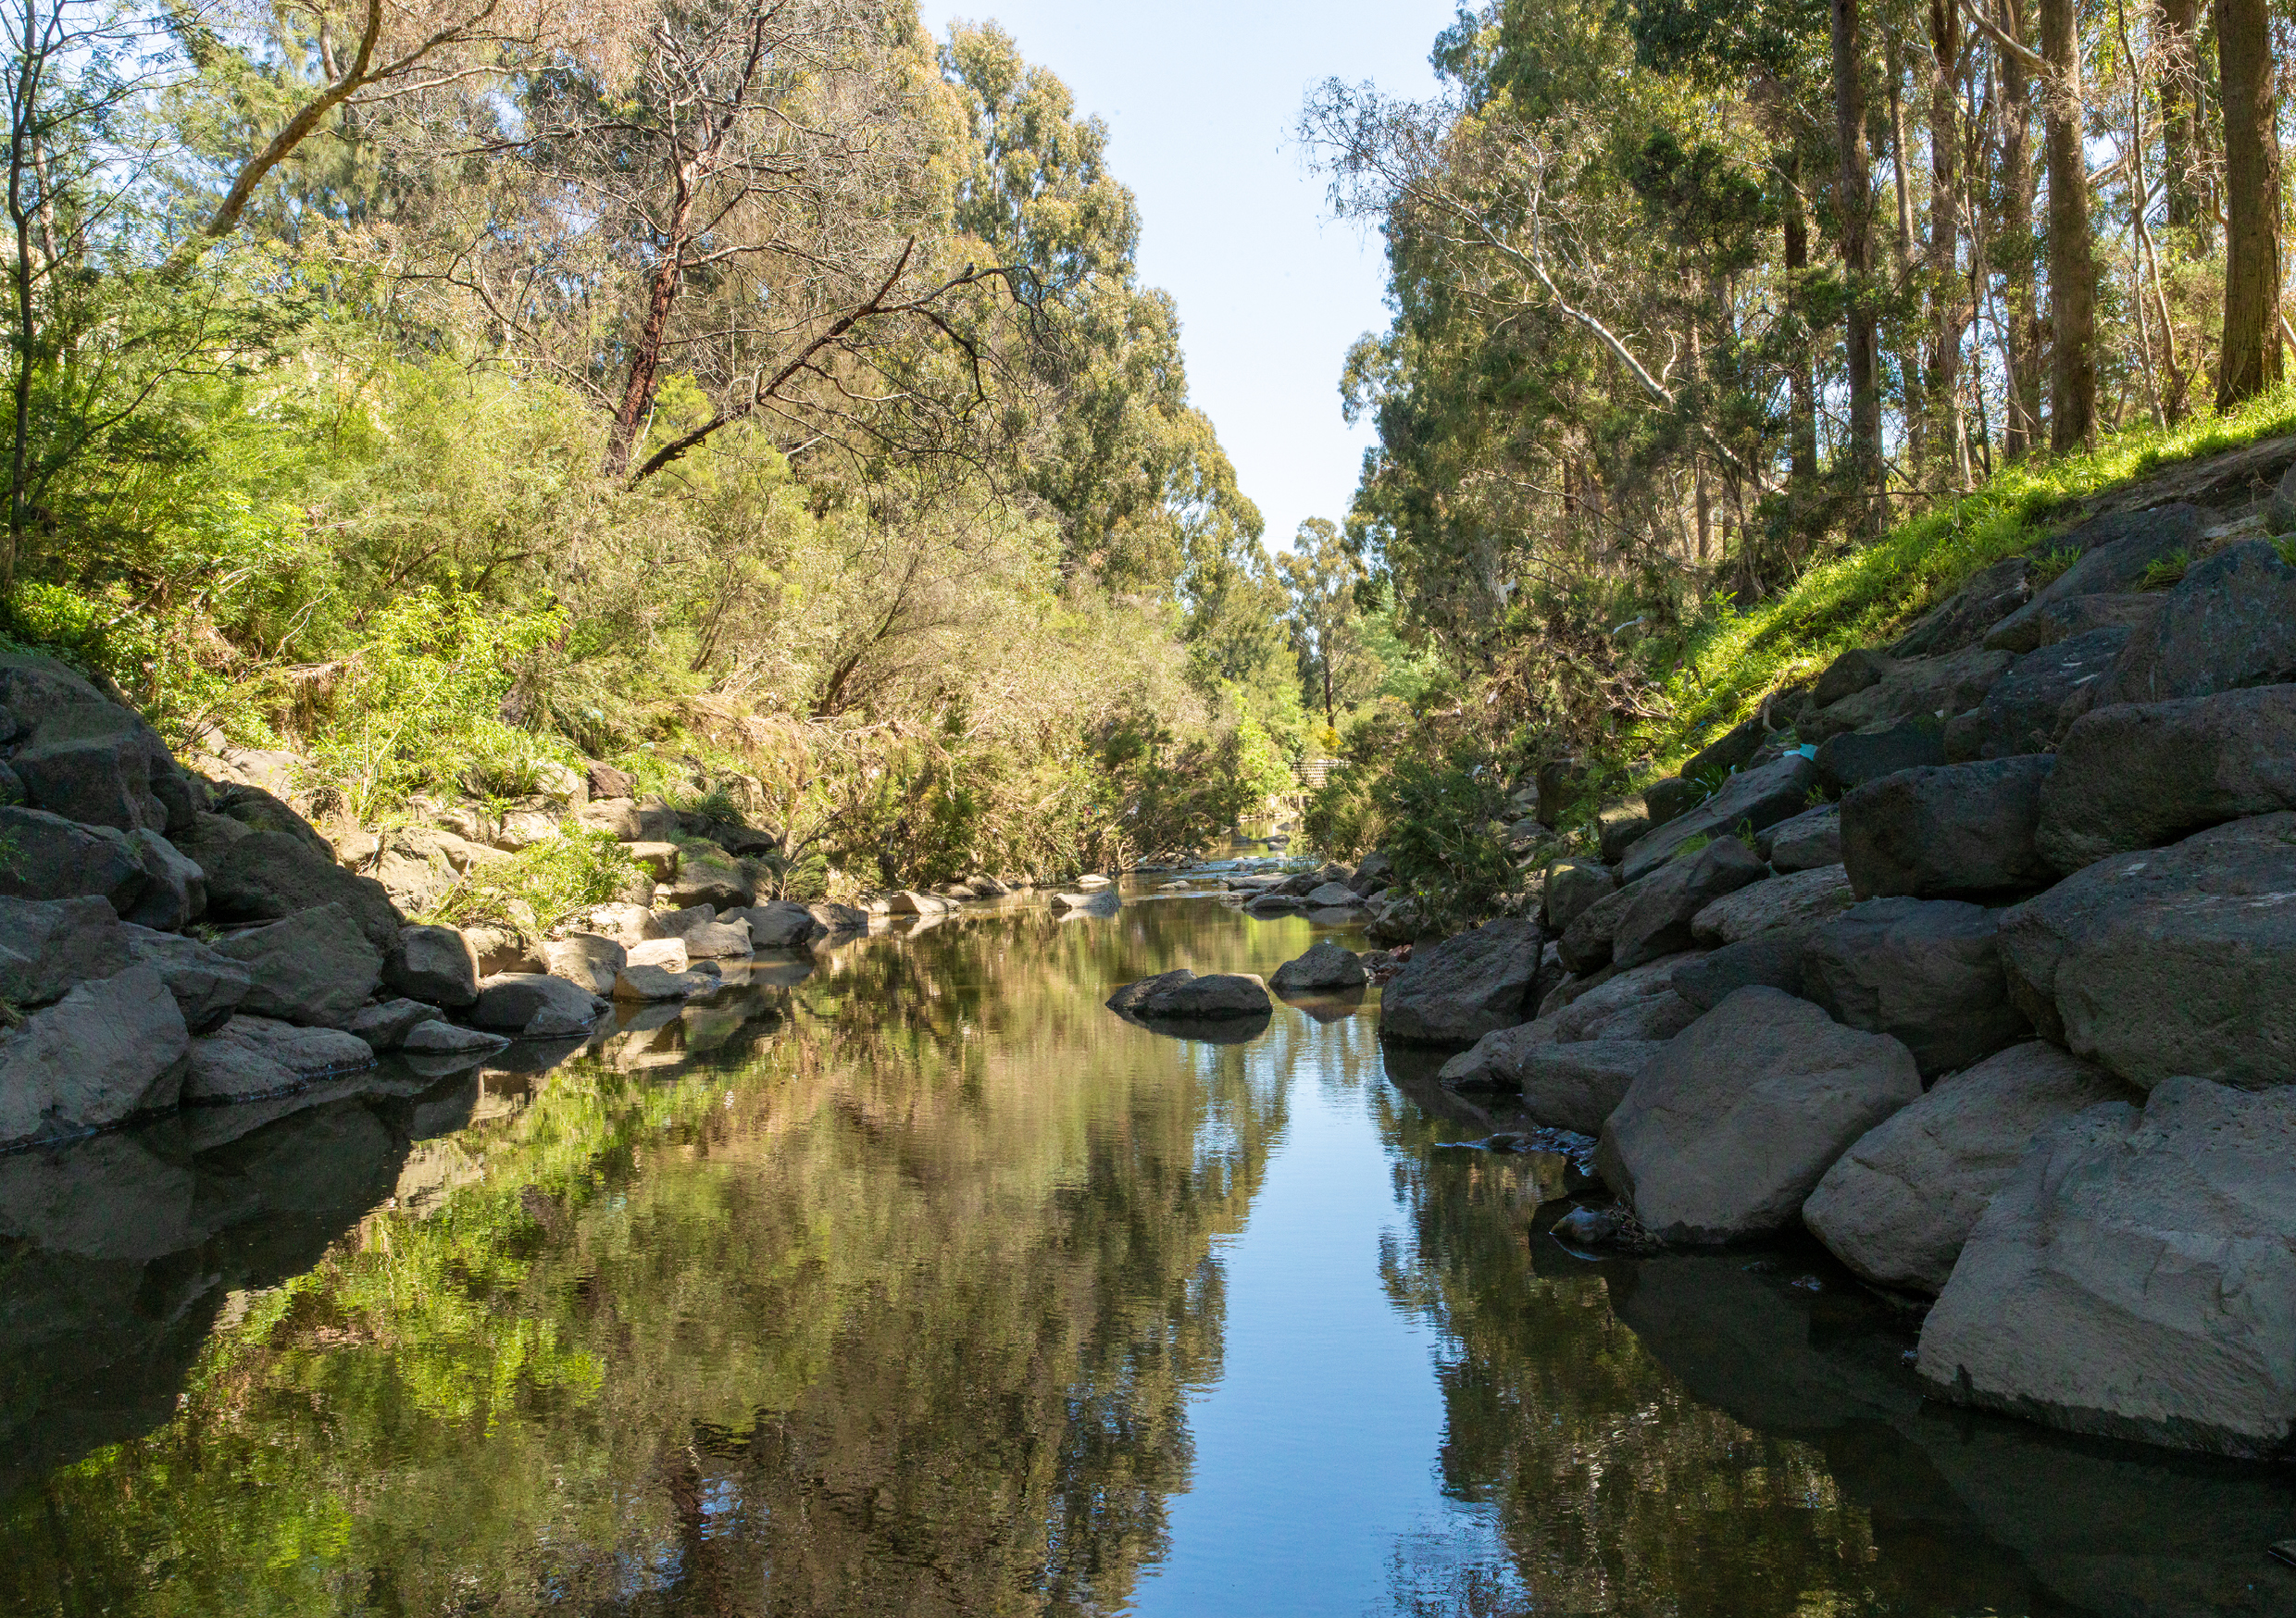
Our councillors unanimously endorsed the Gardiners Creek (Kooyongkoot) Master Plan in October 2022.
In April 2023, we celebrated the official launch of the Gardiners Creek (Kooyongkoot) Regional Collaboration. We are working together with 15 other organisations, including Melbourne Water and Bicycle Network, to improve the cultural, amenity, and environmental value of the Gardiners Creek catchment.
Highlights you can expect to see in coming years include:
- improved connections to Toorak Road by building a shared pedestrian link/bridge at Back Creek Reserve
- upgrading the 4 bridges between Nettleton Park and Dorothy Laver Reserve West to meet Australian standards
- advocating for improvements to the Toorak Road underpass in Hawthorn, so it becomes less prone to flooding and silt build-up.
Theme 3 performance
This is a breakdown of the strategic indicators, progress of initiatives and other service performance indicators for this theme. You can find out more detail about these indicators and previous year’s results in the full report.
You can also read through our continuous improvement initiatives, community engagement, and benchmarking activities for this theme in the full report.
Strategic indicators
Many of our strategic indicators saw consistent or improved results in FY2022-23. The strategic indicators that met or exceeded the forecast include the following.
Kerbside collection waste diverted from landfill (percentage of garbage, recyclables and green organics collected from kerbside bins that is diverted from landfill)
Forecast: 72% to 73%
2022-23 result: 72%
Percentage reduction of Council CO2 emissions compared with 2007-08 emissions
Forecast: 82% to 85%
2022-23 result: 100%
Area of land actively managed for biodiversity
Forecast: 63 to 64 hectares
2022-23 result: 63 hectares
Satisfaction with waste management
Forecast: 71 to 74 (out of 100)
2022-23 result: 71 (out of 100)
Some indicators did not meet our forecast this year:
Volume of harvested water (rain and stormwater) re-used within council buildings and open space irrigation
Forecast: 15mL to 16mL
2022-23 result: 6.7mL
This volume was lower than expected due to the delay in the completion of capital projects and requirements for unscheduled maintenance of key systems.
Percentage reduction of community emissions compared with 2020 emissions
Forecast: 14% to 18%
2022-23 result: 10%
We are providing education and programs from the Climate Action Plan to support our community to achieve this aspirational community target.
Satisfaction with environmental sustainability
Forecast: 67 to 69 (out of 100)
2022-23 result: 64 (out of 100)
We became net-carbon neutral during 2022-23 and continued to deliver an extensive environmental sustainability education program. This result was on par with 2022 and above both state and metro averages.
Progress of initiatives in the Budget
Initiatives that were completed in FY2022-23:
- Progress towards the targets to reduce Council and community emissions established in the Climate Action Plan by implementing the actions detailed in the Implementation Plan for 2022-23.
- Enable monitoring of community progress towards the community emissions targets in the Climate Action Plan through the implementation of a community emissions measurement model.
- Improve the green canopy coverage in our urban spaces for the enjoyment of future generations by implementing a targeted program to increase the planting of trees on local streets by 1,000 per year.
- Improve the community’s ability to access biodiversity and indigenous vegetation now and into the future by ensuring information on the location and size of biodiversity areas are accurately recorded.
- Protect the Gardiners Creek now and into the future through the development and adoption of a master plan for the Gardiners Creek considering recreational, active transport, biodiversity and environmental initiatives.
- Create an Urban Greening Strategy to protect and enhance our landscapes, trees and green cover in response to the challenges of climate, urban heating and urban densification.
- Reduce the volume of materials going to landfill by using a minimum of 20% of recycled materials including glass, plastics and toners in our asphalt products to resurface roads.
- Provide the community with more options to divert polystyrene from landfill by identifying new partnerships for the disposal of expanded polystyrene.
- Commence gradual bin lid replacement to meet Victorian Government requirement to comply with standard bin colours by 2030.
Other service performance indicators
The following other service performance indicators and measures are based on the FY2022-23, unless stated otherwise. For more detail, including supporting commentary and how these results were calculated, see the full annual report PDF.
Waste collection
Kerbside bin collection requests
FY2022-23: 188 requests per 1,000 kerbside bin collection households
FY2021-22: 175 requests per 1,000 kerbside bin collection households
Kerbside collection bins missed
FY2022-23: 9 missed bins per 10,000 scheduled kerbside collection bin lifts
FY2021-22: 5 missed bins per 10,000 scheduled kerbside collection bin lifts
Cost of kerbside garbage bin collection service
FY2022-23: $127 per kerbside garbage collection bin
FY2021-22: $114 per kerbside garbage collection bin
Cost of kerbside recyclables bin collection service
FY2022-23: $94 per kerbside recyclables collection bin
FY2021-22: $86 per kerbside recyclables collection bin
Kerbside collection waste diverted from landfill
FY2022-23: 72%
FY2021-22: 72%
Pagination links
Theme 4: Neighbourhood character and heritage
Theme 4: Neighbourhood character and heritage
Major achievement
Strategic objective
Protect the heritage and respect the character of Boroondara, while facilitating appropriate, well-designed development.
Major initiative 4.1
Support the provision of appropriate housing in Boroondara through review of the Boroondara Housing Strategy 2015, community consultation and presenting a draft updated Boroondara Housing Strategy to our councillors.
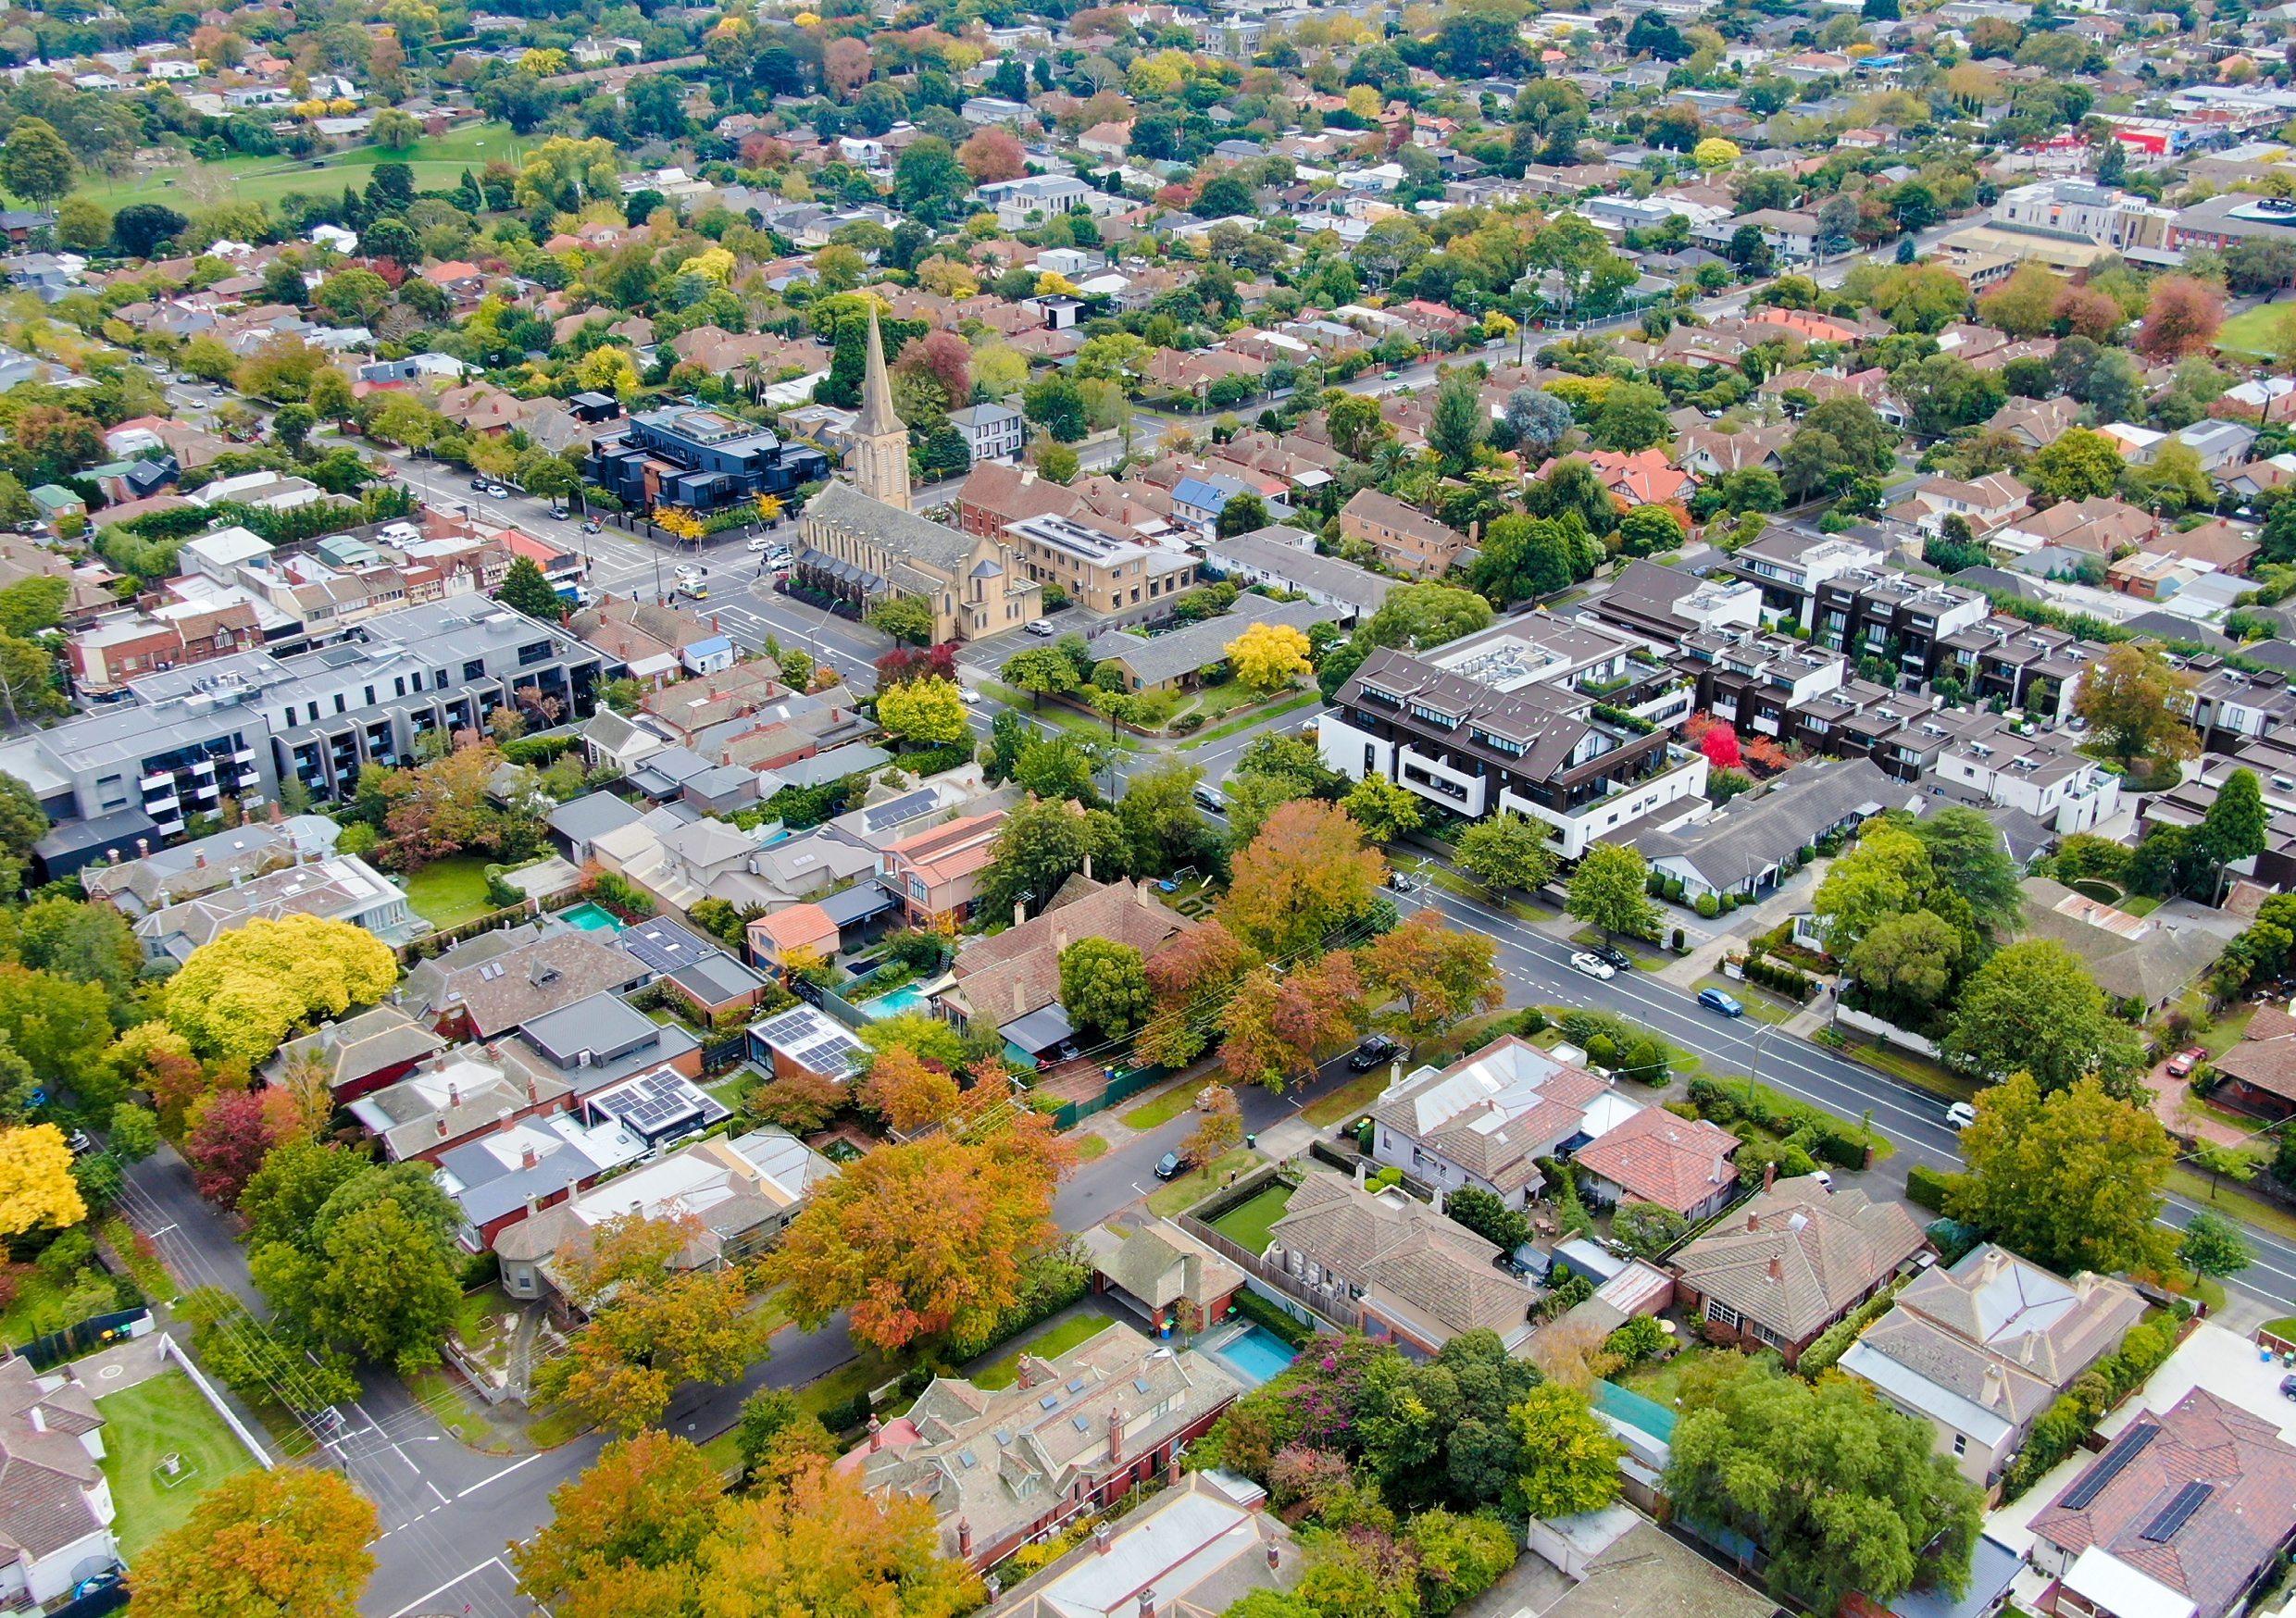
Boroondara Housing Strategy
We have updated our Housing Strategy to plan for our community’s housing needs over the next 15 years. In doing so, we considered the latest evidence, Census data and projections to understand:
- changes to population
- how our community lives
- changes to housing needs
- current and upcoming housing challenges.
Our population continues its ageing trend, with an increase in people over 65 (15% in 2011 and 18% in 2021). Most households are couples with children (34%) and there has also been an increase in single-person and couple-only households. Most houses in Boroondara are stand-alone (53%), followed by medium density (such as townhouses, 29%) and high-density homes (such as apartments, 18%).
Our Housing Strategy is also underpinned by what our community values, including:
- neighbourhood character
- heritage
- green spaces
- responsible, sustainable, and high-quality development
- liveability.
Our Housing Strategy aims to guide different types of housing to appropriate locations, providing diverse housing choices for current and future residents which is critical in supporting a healthy and vibrant Boroondara.
We shared the draft strategy with the community for feedback between May-June 2023.
This consultation confirmed 3 strategic directions to respond to our housing needs and challenges.
- Housing diversity in appropriate locations.
- Housing that is sustainable and achieves design excellence.
- Housing that meets the needs of all residents, now and in the future.
After community consultation, your feedback helped us identify where further consideration, refinement, or actions were needed. This has informed the final Boroondara Housing Strategy, adopted by Council on 18 September 2023. For more information, visit our Boroondara Housing Strategy page.
Theme 4 performance
This is a breakdown of the strategic indicators, progress of initiatives and other service performance indicators for this theme. You can find out more detail about these indicators and previous year’s results in the full report.
You can also read through our continuous improvement initiatives, community engagement, and benchmarking activities for this theme in the full report.
Strategic indicators
In almost all cases, our strategic indicators saw consistent or improved results in FY2022-23. The strategic indicators that met or exceeded the forecast include the following.
Percentage of ‘demolition consents’ under section 29A of the Building Act by Building Services checked within 15 business days
Forecast: 100%
2022-23 result: 100%
Percentage of Council planning decisions upheld and decisions successfully mediated at VCAT
Forecast: 45% to 55%
2022-23 result: 71%
Average number of days to process a planning application
Forecast: 35 to 45 days
2022-23 result: 37.5 days
Number of heritage planning scheme amendments considered by Council
Forecast: 5 to 6 amendments
2022-23 result: 5 amendments
An indicator that did not meet our forecast this year was the number of “out of time” planning reviews at VCAT where the appeal was lodged more than 2 weeks after the final consultation with the applicant or objector(s) (forecast: 5 to 15, 2022-23 result: 4). With only 4 “out of time” planning review appeals lodged for FY2022-23, the result is still positive.
Progress of initiatives in the Budget
Initiatives that were completed in FY2022-23:
- Support the provision of appropriate housing in Boroondara through review of the Boroondara Housing Strategy 2015, community consultation and presenting a draft updated Boroondara Housing Strategy to our councillors and consideration of associated planning scheme changes including residential zones.
- Enhance protection of Boroondara’s heritage assets by preparing and presenting to our councillors for endorsement an updated Heritage Action Plan to guide our future work program for heritage protection advocacy.
- Facilitate sustainable development by investigating the introduction of an Environmentally Sustainable Design Policy to the Boroondara Planning Scheme.
- Improve pool and spa safety and life safety for our community through investigating and implementing a new Building Infringement Notice for specified Pool and Spa safety breaches and non-compliance of Essential Safety Measures (ESM) in Class 2-9 public buildings.
- Celebrate and protect Boroondara’s heritage by updating the Heritage Action Plan and establishing a process for assessing community heritage nominations.
Other service performance indicators
The following other service performance indicators and measures are based on the FY2022-23, unless stated otherwise. For more detail, including supporting commentary and how these results were calculated, see the full annual report PDF.
Statutory Planning
Planning applications decided within required timeframes
FY2022-23: 59%
FY2021-22: 59%
Time taken to decide planning applications
FY2022-23: 102 days
FY2021-22: 81 days
Council planning decisions upheld at VCAT
FY2022-23: 44%
FY2021-22: 53%
Cost of statutory planning service
FY2022-23: $4,102 per planning application received
FY2021-22: $3,617 per planning application received
Pagination links
Theme 5: Moving around
Theme 5: Moving around
Major achievement
Strategic objective
Travel options are safe, efficient and accessible with active and public transport encouraged.
Major initiative 5.6
Represent the Boroondara community in decision making by advocating to the Victorian government in relation to public and active transport, open space, urban design and environmental opportunities associated with the North East Link and the Union Road Level Crossing Removal projects.
North East Link and Union Road level crossing removal
The North East Link (NEL) and Union Road level crossing removal (LXR) are 2 major Victorian Government infrastructure projects impacting our community. Since their announcement, we have been advocating on behalf of and with our community for positive outcomes for Boroondara.
In FY2022-23 financial year, we focused on:
- reviewing and monitoring designs, early works and construction works associated with the NEL and Union Road level crossing removal projects in Boroondara
- ensuring the projects, despite their significant impacts, leave a positive legacy for the local community
- ensuring our community’s needs are taken into account by listening to our residents and advocating on their behalf
- building relationships with key stakeholders throughout the project areas.
Our efforts this year enabled us to secure funding from the North East Link Program (NELP) for canopy tree planting at Freeway Golf Course, and maintenance of NELP-funded canopy trees at Hyde Park.
In addition, we continued to:
- identify sites for further tree planting to offset NEL tree removal
- review plans for site investigations planned by NELP and their contractors to ensure impacts on residents and amenity were reduced where possible.
We worked closely with Level Project Removal Project (LXRP) throughout the Big Dig (mid-February to late-May 2023) for the Union Road LXR, which was a difficult time for residents and traders. We advocated for shuttle buses to provide local transport and shopping incentives to support local traders. During this period, we ensured services such as bin collections continued as normal and endeavoured to protect parking spaces in the village. Our work with LXRP also involved refining designs for the extended Union Road Bridge and open space to provide green spaces that support community activity, connection and relaxation in the Surrey Hills shopping precinct.
Theme 5 performance
This is a breakdown of the strategic indicators, progress of initiatives and other service performance indicators for this theme. You can find out more detail about these indicators and previous year’s results in the full report.
You can also read through our continuous improvement initiatives, community engagement, and benchmarking activities for this theme in the full report.
Strategic indicators
A number of our strategic indicators saw consistent or improved results in FY2022-23. The strategic indicators that met or exceeded the forecast include the following.
Percentage of footpath inspections and make safe actions completed within the timeframes as specified in the Road Management Plan
Forecast: 95% to 100%
2022-23 result: 95%
Number of sustainable transport programs delivered to primary schools
Forecast: 2 to 8
2022-23 result: 6
Number of advocacy initiatives related to public transport services
Forecast: 10 to 15
2022-23 result: 19
Some indicators did not meet our forecast this year:
Satisfaction with sealed local roads
Forecast: 73 to 76 (out of 100)
2022-23 result: 67 (out of 100)
We have seen a decline of 4 points in the Customer Satisfaction Survey results. Significant rain events in October to November 2022 increased road defects, which may have contributed to this. Our performance on sealed local roads is still 6 points higher than metro (61) and 19 points higher than the state level (48).
Percentage of sealed local roads that are below the renewal intervention level set in the Road Management Plan
Forecast: 95% to 100%
2022-23 result: 91%
Increased funding has seen a 1.64% improvement on the 2021-22 result, and additional funding and new modelling indicate that we will return to the annual target by the end of the 2025-26 financial year.
Average daily bicycle users for Gardiners Creek Trail, the Anniversary Trail, Koonung Trail and Main Yarra Trail
Forecast: 3,900 to 4,500
2022-23 result: 3,239
Seasonal influence over autumn and the start of winter have impacted bicycle use, with a very wet winter and spring.
Satisfaction with local shared paths for cycling and walking as a way to get around Boroondara
Forecast: 67% to 70%
2022-23 result: 61%
In line with perception last year, social factors in how people now live and work in their local areas means there continues to be a larger proportion of people utilising these spaces than pre-COVID. The impact of works and delays may have been a factor in satisfaction levels from the year before. This includes the closure of the Walmer Street Bridge while a new northern land bridge is built, the lack of progress by the Department of Transport and Planning on significant projects like the Anniversary Trail crossing at Toorak Road, and delays in delivering the lighting initiatives for sections of the Anniversary Trail.
Number of traffic counts and surveys used to investigate, assess, and respond to traffic and parking issues
Forecast: 200 to 220
2022-23 result: 171
Following COVID-19 impacted years, traffic counts and surveys restarted with a significant increase from 95 in FY2021-22. This year’s result was impacted by the extended Union Road closure between February and May 2023, which affected counts and surveys in the surrounding area.
Progress of initiatives in the Budget
Initiatives that were completed in FY2022-23:
- Seek to provide an integrated bicycle network that is safe, connected, protected, efficient and appealing to bicycle users of all ages and abilities by developing and adopting a bicycle strategy.
- Provide a safe and accessible shared path for the community by advocating to the Victorian Government for the Box Hill to City cycling corridor project.
- Encourage public transport use and improve access and safety through a range of infrastructure initiatives for the Walmer Street Bridge, Yarra Boulevard and public transport services including disability access through advocacy with the Victorian Government.
- Encourage sustainable travel options by undertaking bicycle promotional and behaviour change programs for children including travel plans for primary and high schools and Safe Routes to School initiatives.
- Represent the Boroondara community in decision making by advocating to the Victorian government in relation to public and active transport, open space, urban design and environmental opportunities associated with the North East Link and the Union Road Level Crossing Removal project.
The one initiative for this theme that commenced in FY2022-23 and is 75% complete was improving safety and security of shared paths and paths by progressively installing energy efficient lighting. For this we are progressively lighting the extensive network of shared paths and paths with a focus on the Anniversary Trail between Whitehorse Road and Mont Albert Road.
Other service performance indicators
The following other service performance indicators and measures are based on the FY2022-23, unless stated otherwise. For more detail, including supporting commentary and how these results were calculated, see the full annual report PDF.
Roads
Sealed local roads maintained to condition standards
FY2022-23: 91%
FY2021-22: 92%
Cost of sealed local road reconstruction
FY2022-23: $115
FY2021-22: $104
Cost of sealed local road resealing
FY2022-23: $30
FY2021-22: $27
Satisfaction with sealed local roads
FY2022-23: 67
FY2021-22: 71
Sealed local road requests
FY2022-23: 97 requests per 100 kilometres of sealed local road
FY2021-22: 66 requests per 100 kilometres of sealed local road
Pagination links
Theme 6: Local economy
Theme 6: Local economy
Major achievement
Strategic objective 6
Support local businesses and enhance shopping precincts, fostering a strong economy and welcoming places for the community.
Major initiative 6.1
Support business COVID-19 recovery through targeted programs and initiatives such as promoting Main Street Australia week, provision of business information workshops, mentoring, outdoor activation in shopping centres and buy local programs.
Supporting local businesses and shopping precincts
Supporting businesses to reboot and encouraging the community to shop and dine locally has been a continued focus over the past year.
We have been able to facilitate continued outdoor trading, resume regular Council-run business information events and complete the first phase of upgrades for the Camberwell Fresh Food Market.
We’ve continued to support traders through their COVID-19 recovery with a variety of activities that aim to:
- enhance our shopping precincts
- support continued and safe outdoor trading
- deliver valued information and networking opportunities for our business community.
We adopted the Outdoor Trading Policy and Guidelines in November 2022 which included the transition to a parklet permit program for eligible businesses. This provides a way for businesses to extend their trading footprint using 'parklets’ (repurposed car-parking spaces) that help to activate our shopping precincts.
In December 2022, we also delivered the first phase of upgrades for the Camberwell Fresh Food Market. New seating areas have been installed to encourage customers to stay longer to enjoy the market. We have also been working with the market to attract new tenants to increase the diversity of stallholders.
We introduced the Go Full Circle program in 2022 in partnership with 3 neighbouring councils. Through a series of workshops, this program supports local participating businesses to build their capacity to operate in a more environmentally sustainable way, while also attracting new customers.
We ran a total of 50 business workshops and events this year providing valuable education and networking opportunities for our local business and not-for-profit community. In response to growing demand, we will continue to run frequent events in 2023-24 to support local businesses to connect with each other and continue to develop new skills.
Theme 6 performance
This is a breakdown of the strategic indicators, progress of initiatives and other service performance indicators for this theme. You can find out more detail about these indicators and previous year’s results in the full report.
You can also read through our continuous improvement initiatives, community engagement, and benchmarking activities for this theme in the full report.
Strategic indicators
In most cases, our strategic indicators saw consistent or improved results in FY2022-23. The strategic indicators that met or exceeded the forecast include the following.
Number of proactive strip shopping centre maintenance inspections completed
Forecast: 1,250 to 1,500
2022-23 result: 1,349
Participant satisfaction in Council’s business training activities
Forecast: 80% to 85%
2022-23 result: 80%
Number of permits for outdoor trading
Forecast: 120 to 130
2022-23 result: 165
An indicator that did not meet our forecast this year was satisfaction with work to improve quality of streetscapes in shopping precincts to attract and retain good shops and businesses (forecast: 57% to 58%, 2022-23 result: 50%). Community satisfaction on this has decreased by 9% from 2022 in the Community Satisfaction Survey. Streetscape improvement projects were completed in the Bellevue and Solway wards in 2022. A placemaking program is underway, which will help to improve the community’s experience of our shopping centres in Maling Road, Canterbury, Glenferrie Road, Hawthorn and Camberwell Junction. Streetscape designs for future upgrades have received positive community responses in 2022-23. Furthermore, we have established the Boroondara Service Crew who to clean rubbish bins, street furniture, street signage, carry out minor maintenance and spot cleaning of footpaths.
Progress of initiatives in the Budget
Initiatives that were completed in FY2022-23:
- Support business COVID-19 recovery through targeted programs and initiatives such as promoting Main Street Australia week, provision of business information workshops, mentoring, outdoor activation in shopping centres and buy local programs.
- Increase the vibrancy of the Glenferrie Road precinct and aid the economic recovery of local traders following the impacts of the COVID-19 pandemic on the local economy by implementing short-term 2022-2023 projects in the Glenferrie Place Plan.
- Increase the vibrancy of the Maling Road precinct and aid the economic recovery of local traders following the impacts of the COVID-19 pandemic on the local economy by implementing short-term 2022-2023 projects in the Maling Road Place Plan.
- Promote the Camberwell Junction Precinct as a major economic centre in metropolitan Melbourne through the completion of the draft Camberwell Place Plan, community engagement and review of the Camberwell Junction Structure Plan.
- Revitalise Boroondara’s most important precincts by progressing a draft long-term placemaking strategy that identifies and prioritises investment in key activity centres across the city.
The one initiative for this theme that commenced in FY2022-23 and is 90% complete is enhancing the vibrancy and economic sustainability of the local economy by the completion of the Economic Development and Tourism Plan in consultation with the business community. The draft Economic Development and Tourism Strategy was updated following feedback provided during the public consultation period (January to March 2023). A Council report seeking endorsement for the strategy has been prepared and will be presented to our councillors in the second half of 2023.
Pagination links
Theme 7: Governance and leadership
Theme 7: Governance and leadership
Major achievement
Strategic objective
Ensure decisions are financially and socially responsible through transparent and ethical processes.
Major initiative 7.7
Work with Aboriginal and Torres Strait Islander peoples and the community to promote and support reconciliation in Boroondara by implementing Year 1 actions of the Boroondara Reconciliation Strategy 2022-26.
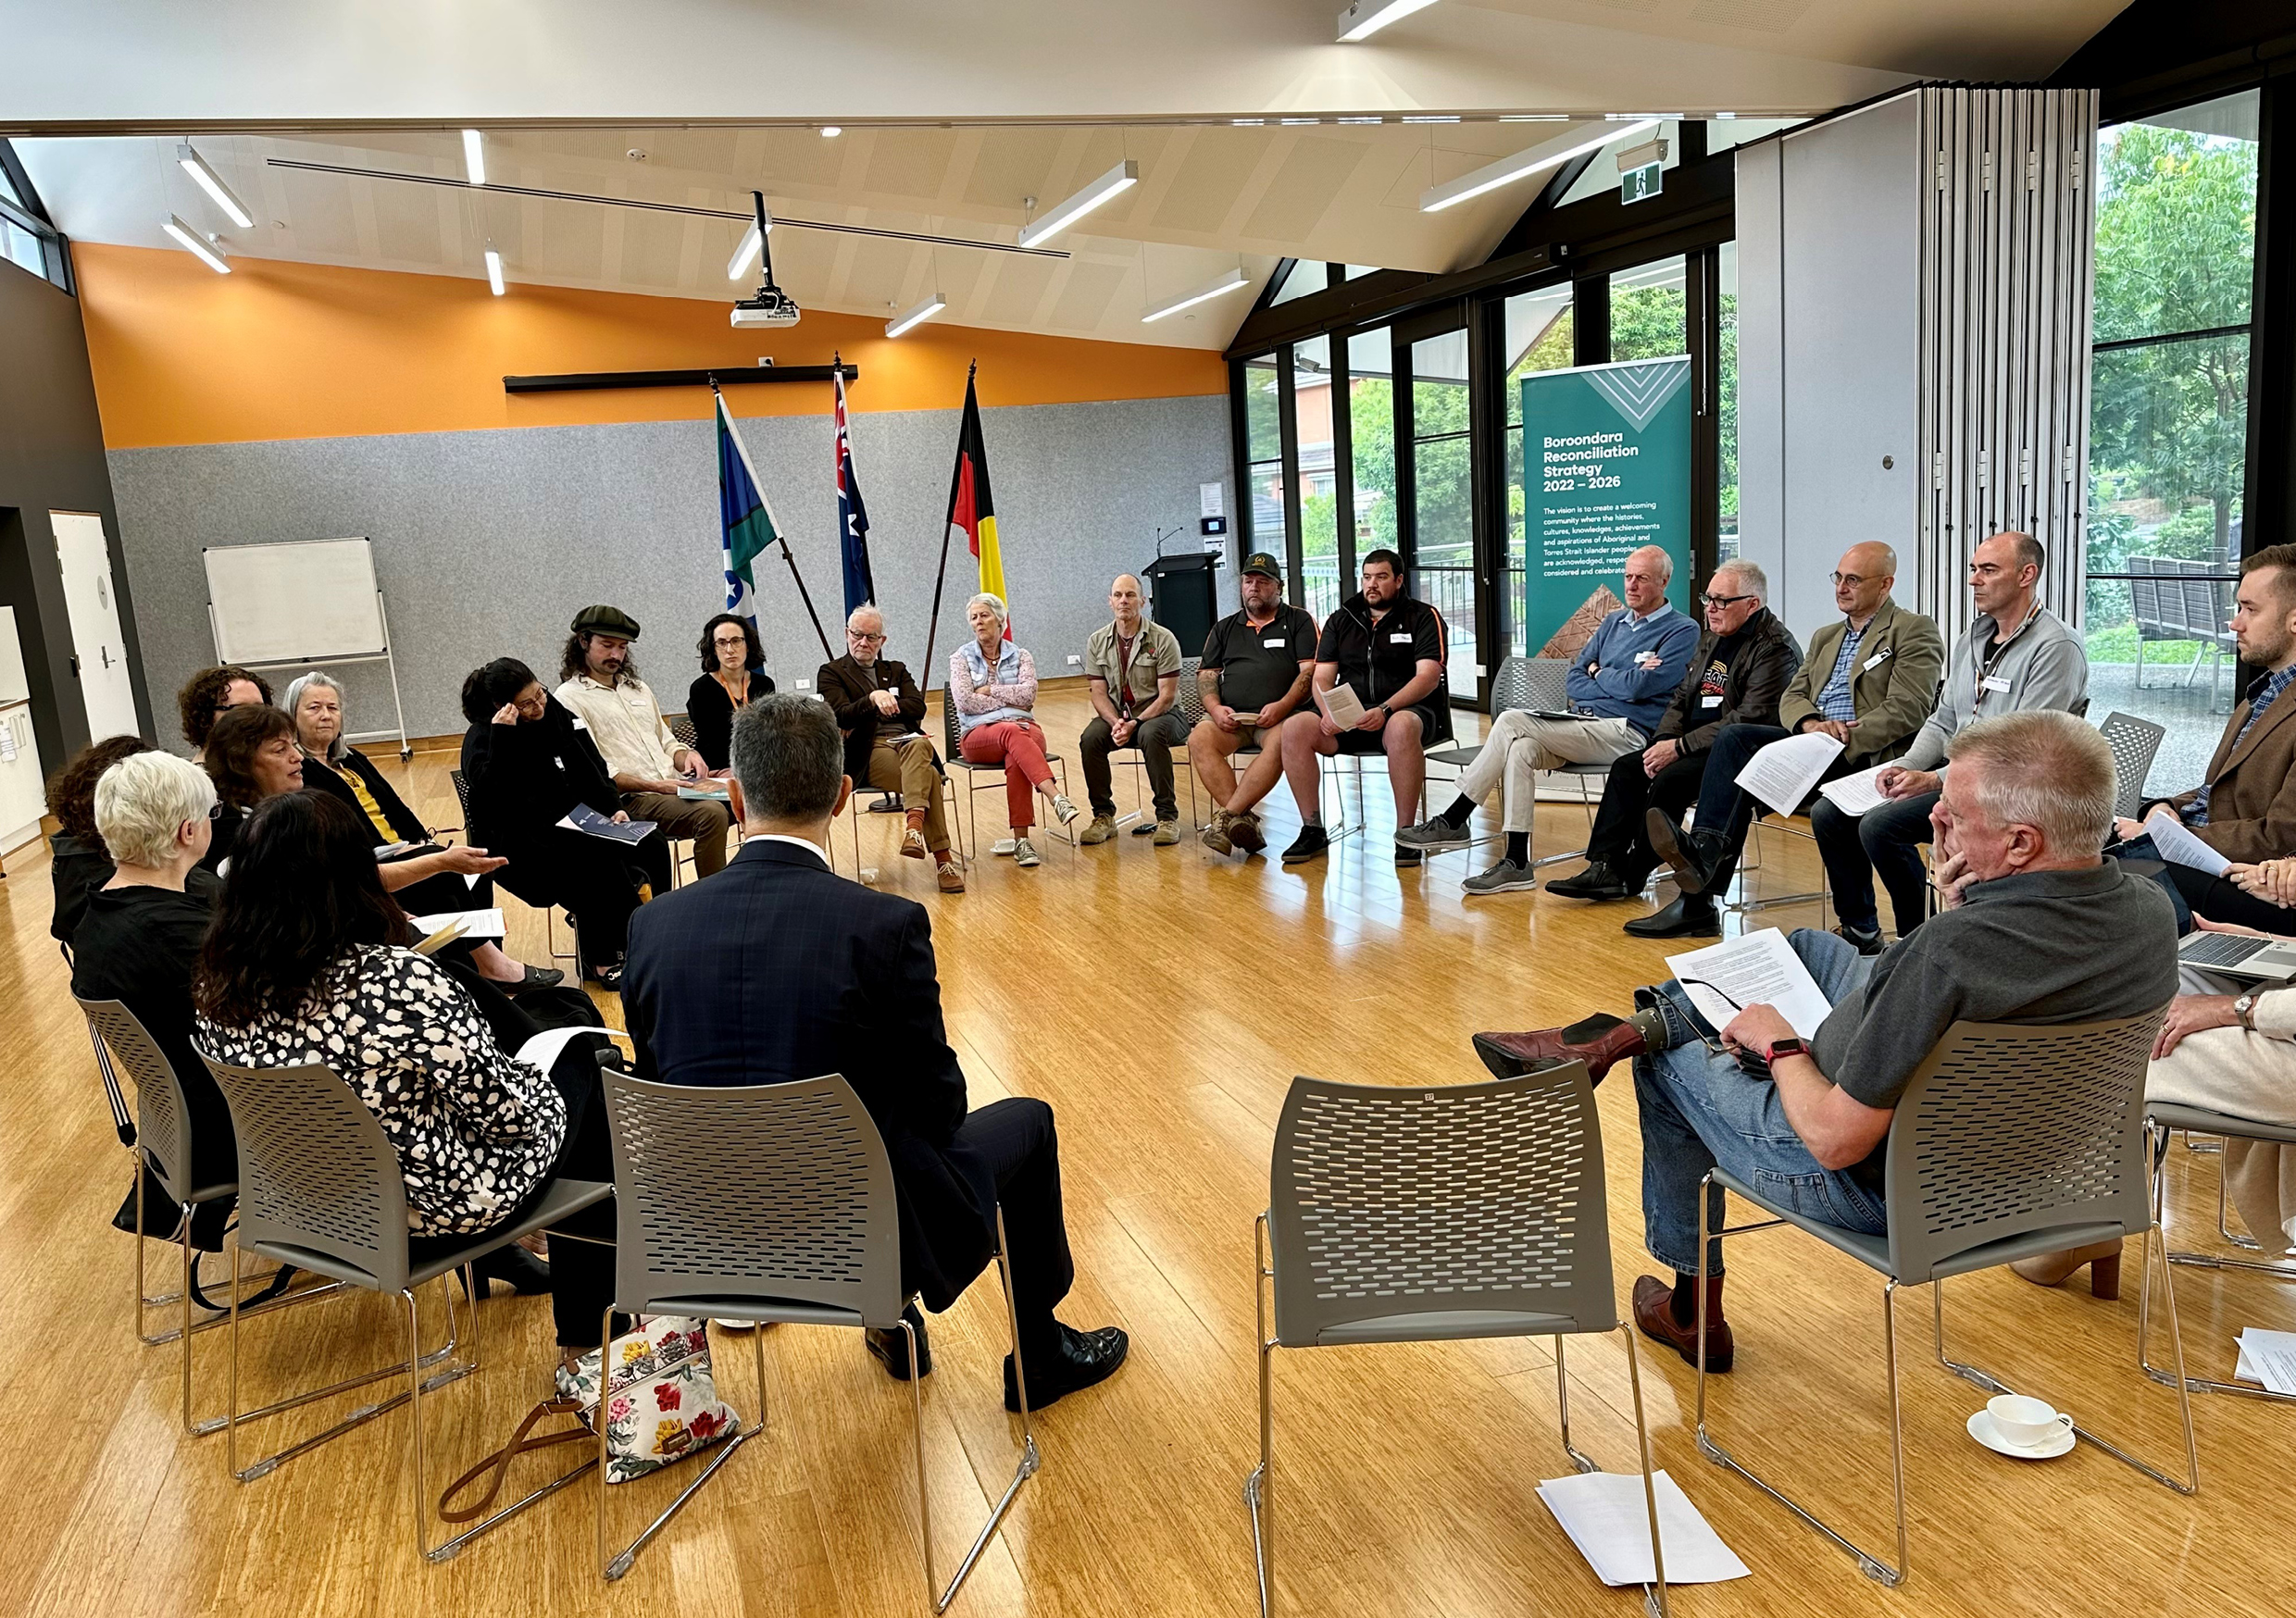
Boroondara Reconciliation Strategy
Part of the vision of the Boroondara Reconciliation Strategy is to strengthen relationships with Aboriginal and Torres Strait Islander organisations and peoples, so we can work in partnership together, and with our broader community, to progress reconciliation locally.
During year 1 of the strategy, we aimed to strengthen existing relationships and hear from diverse voices from the Aboriginal and Torres Strait Islander sector on a range of local projects. We have a strong foundation to build on and continue to develop respectful, flexible, genuine relationships built on cultural understanding and reciprocity with Aboriginal and Torres Strait Islander peoples and organisations.
This year, councillors and Council officers who make up our internal Boroondara Reconciliation Advisory Committee heard from a range of presenters, including Elders from Wurundjeri Woi-wurrung Cultural Heritage Aboriginal Corporation and local Aboriginal and Torres Strait Islander peoples and organisations.
Our officers also met regularly with Wurundjeri Woi-wurrung Elders to consult on a range of projects including the development of the Gardiners Creek (Kooyongkoot) Master Plan and the City of Boroondara Sport and Recreation Inclusion Guide, which will be available on our website later this year. These cultural consultations were also an opportunity to keep the Elders informed about the progress of our Reconciliation Strategy actions.
We also hosted a special information session to thank a diverse range of stakeholders from the local Aboriginal and Torres Strait Islander sector and express our gratitude for their time, contribution, and expertise during the first year of the strategy.
Theme 7 performance
This is a breakdown of the strategic indicators, progress of initiatives and other service performance indicators for this theme. You can find out more detail about these indicators and previous year’s results in the full report.
You can also read through our continuous improvement initiatives, community engagement, and benchmarking activities for this theme in the full report.
Strategic indicators
Many of our our strategic indicators saw consistent or improved results in FY2022-23. The strategic indicators that met or exceeded the forecast include the following.
Percentage of Freedom of Information requests responded to within prescribed timeframes
Forecast: 100%
2022-23 result: 100%
Satisfaction with informing the community
Forecast: 65 to 67 (out of 100)
2022-23 result: 65 (out of 100)
Current assets compared to current liabilities
Forecast: 201.97%
2022-23 result: 224.08%
Number of transactions initiated via our website
Forecast: 68,330 to 70,000
2022-23 result: 100,084
Number of cybersecurity incidents that compromise user data
Forecast: 0
2022-23 result: 0
Access to Council’s website (percentage of time available)
Forecast: 99.8% to 100%
2022-23 result: 99.99%
Some indicators did not meet our forecast this year:
Satisfaction with community consultation and engagement
Forecast: 62 to 64 (out of 100)
2022-23 result: 59 (out of 100)
This result is consistent with previous years and performance across state and metro groups. Through recent research, we gained deeper insights into what underpins the community’s perception of our performance in this area. This identified several opportunities to promote community awareness, use clearer language, increase our focus on consultations for hyper-local issues, and improve how we communicate with the community after consultations.
Satisfaction with the overall performance of Council
Forecast: 71 to 72 (out of 100)
2022-23 result: 67 (out of 100)
We continue to be one of the highest performing councils in this area. While this is a decline of 4 points from FY2021-22, this mirrors declines across the sector. Within a challenging landscape of lower consumer sentiment and financial pressures experienced by households, we continue to perform in line with or higher than the metro (62) and state (56) average.
Satisfaction with customer service
Forecast: 77 to 79 (out of 100)
2022-23 result: 73 (out of 100)
Providing excellent customer service that meets community expectations continues to be a focus area for us. Initiatives are in place across all service areas to ensure our aspiration of always putting the customer at the centre of what we do is achieved to the satisfaction of our residents.
Satisfaction with making community decisions
Forecast: 61 to 63 (out of 100)
2022-23 result: 59 (out of 100)
This has remained at the same level as the previous 9 years. We will continue to place the community interests at the centre of our decision-making.
Average time callers wait before their call is answered
Forecast: 45 to 60 seconds
2022-23 result: 70 seconds
In April to June 2023 our customers waited 39 seconds on average for the call to be answered, which is well below our KPI of less than 60 seconds. The higher average wait time for the full year was caused by resourcing challenges in July to September 2022, and unexpected call volumes in October to December 2023 from the change in vendor for recycling collections.
Number of calls abandoned when customers are trying to reach Council's customer service
Forecast: 3% to 3.5%
2022-23 result: 5.5%
We met our target of 3.5% in January to June 2023. The full year’s result did not meet the forecast due to impacts relating to resource capacity caused by illness, challenges with a new waste service provider, and an increase in calls due to severe weather in July to December 2022.
Percentage of adopted capital projects completed at the conclusion of the financial year (based on most recent amended budget).
Forecast: 90% to 95%
2022-23 result: 78%
Issues inhibited project delivery including a WorkSafe investigation, delayed community consultations, additional consultation due to scope changes, weather, building permit delays, other authority delays, the global supplies shortage, long lead time, availability of contractors, and low tender submissions.
Progress of initiatives in the Budget
Initiatives that were completed in FY2022-23:
- Ensure we operate within a financially sustainable framework through preparation of the Annual Budget 2023-24 (plus 3 subsequent financial years) in-line with statutory requirements and submit for consideration by our councillors
- Services are designed to deliver enhanced customer and business value through the review of a minimum of 3 ‘customer facing’ services using a service design approach.
- Performance reporting is engaging and fit-for-purpose for the community and decision-makers through implementing enhancements to our reporting mechanisms and communication methods.
- Enable effective management of customer requests by completing the detailed design and commencing the build of our new customer and relationship management system.
- Enhance management of property and rating activities, including management of customer enquiries for rates, permits, infringements and land information by completing the detailed design and commencing the build of our new property and rating system.
- Work with Aboriginal and Torres Strait Islander peoples and the community to promote and support reconciliation in Boroondara by implementing year 1 actions of the Boroondara Reconciliation Strategy 2022-26.
- Educate our community on our decision-making processes by refreshing the video content available on our website.
- Protect customer privacy and data through securely managing, monitoring and enhancing current software to minimise service disruptions and the risk of data security breaches.
The one initiative for this theme that commenced in FY2022-23 and is 20% complete was improving customer experience and satisfaction by implementing the Customer Charter and communicating our service principles to the community. The Customer Charter has been reviewed and areas for improvement have been identified, including revisions to contemporise the message to meet current community expectations and address customer and team member understanding of the service commitments. The Customer Charter (now Customer Promise) has been reworded and introduced as an improvement initiative in the August Boroondara Bulletin, with further communication scheduled for September to October 2023.
Other service performance indicators
The following other service performance indicators and measures are based on the FY2022-23, unless stated otherwise. For more detail, including supporting commentary and how these results were calculated, see the full annual report PDF.
Governance
Cost of elected representation
FY2022-23: $54,403
FY2021-22: $53,352
Satisfaction with Council decisions
FY2022-23: 59 (out of 100)
FY2021-22: 61 (out of 100)
Councillor attendance at council meetings
FY2022-23: 98%
FY2021-22: 98%
Satisfaction with community consultation and engagement
FY2022-23: 59 (out of 100)
FY2021-22: 59 (out of 100)
Council decisions made at meetings closed to the public
FY2022-23: 5%
FY2021-22: 4%
Pagination links
Challenges and future outlook
Challenges and future outlook
In FY2022-23 we faced the following challenges:
- A significant workload management challenge for Building Services staff, relating to the over 1,300 ‘Notices to Comply’ that were issued to pool and spa owners who had not lodged their Certificate of Compliance (Form 23) by the deadline.
- Dealing with buildings comprising of combustible cladding and enforcement of same.
- Recruiting and retaining Registered Building Practitioners (RBP) in a competitive environment.
- The relocation of 2 Community Bands (Boroondara Brass, Glenferrie Brass) to a new home during the demolition process of The Ferguson Stand in Hawthorn.
- Incorporating the launch of the Central Immunisation Records Victoria (CIRV) software on 24 June, and retaining the immunisation service.
- Outreach staff were unable to provide outreach services outside of regular business hours in response to homelessness reports.
- Changes to processes involving debt recovery due to changes to the Local Government Legislation Amendment (Rating and Other Matters) Act 2022.
- The lack of clarity around the future funding framework for the Commonwealth Home Support Program (CHSP).
- The ongoing effects of major project works on local businesses in Union Road in Surrey Hills, as a result of the Level Crossing Removal Project.
- Difficulties with the global supply chains causing delays in the delivery of equipment, as well as resource constraints.
- The vast amount and complexity of information we provide, causing difficulty for us to create immediately accessible content and answer individual queries through a simple search or direct message on social media channels.
COVID-19 challenges
The COVID-19 pandemic has also continued to be a challenge across many areas:
- COVID-19, and unexpected absences or modification, requiring modifications to Council and Delegated committee meeting protocols, officer attendance, and technology integration to meet the requirements of the Local Government Act 2020 and our Governance Rules.
- Fluctuating staffing levels due to the effects of the COVID-19 pandemic and influenza on the workforce.
- Fewer volunteers are attending events, workshops, and applying for volunteer roles following the COVID-19 pandemic.
- Increased construction material costs after the COVID-19 pandemic, a lack of supply and an increase in labour costs.
- The split community desire for online activities and events in the wake of COVID-19, compared to some community members wanting to return to face-to-face activities.
- The high need for study and working areas in the libraries, with many people continuing to work from home and choosing to do so from a library.
The Future
We will:
- maintain a high level of excellence in the provision of services, programs, and facilities to the Boroondara community, with a particular emphasis on a range of key services, projects, and policies
- implement our People Strategy, which will serve as a focal point that will serve as a visual and textual framework for the development and implementation of people and culture activities over the next 2 to 3 years
- focus on the negotiation for our next Enterprise Agreement
- enhance officer education and professional development in the Planning and Placemaking Department, to allow us to better adapt to the evolving trends in the development sector and economy
- maintain oversight of service transformation in event coordination and client experience when planning and executing events
- focus on our Building Services department being an innovative, progressive and highly engaged department to serve Boroondara customers and residents with a compassionate and customer focused service
- focus on the Facilities, Waste and Infrastructure department providing reliable services and respond to customer queries quickly
- develop a shared vision for Boroondara Libraries of a modern library service that responds to the evolving needs of the community in the post COVID-19 era
- focus our efforts over the next 12 months on the ongoing construction of a new Kew Library that will cater to the needs and aspirations of the local community
- focus on upgrading our core system in the Asset and Capital Planning department and continue to incorporate new systems into our workflows.
Pagination links
Corporate governance
Corporate governance
We provide leadership and good governance to the municipal district and the local community. Our role includes:
- taking into account the diverse needs of our community in decision-making
- providing leadership by establishing strategic objectives and monitoring achievements
- ensuring resources are managed in a responsible and accountable manner
- advocating the interests of our community to other communities and governments
- fostering community cohesion and encouraging active participation in civic life.
We maintain strong relationships with other tiers of government, neighbouring councils, and organisations such as electricity and water distributors.
Council meetings and delegated committees
Attendance
Council meetings are open to the public and usually scheduled on the fourth Monday of each month. In accordance with the requirements of the Governance Rules, additional, unscheduled Council meetings may be called when required.
In FY2022-23, we held 18 Council meetings. The table below reflects the number of Council meetings attended by each councillor, and the Council meetings in which councillors had Council-approved leave of absence and therefore were not present at the meeting.
Councillors | Total Council meetings attended | Meeting dates where a councillor was granted a leave of absence |
|---|---|---|
Cr Felicity Sinfield (Mayor) | 18 | No leave of absence |
Cr Lisa Hollingsworth (Deputy Mayor) | 16 | 19 June 2023 |
Cr Jim Parke | 18 | No leave of absence |
Cr Victor Franco | 17 | 26 June 2023 |
Cr Wes Gault | 18 | No leave of absence |
Cr Di Gillies | 18 | No leave of absence |
Cr Jane Addis | 18 | No leave of absence |
Cr Cynthia Watson | 13 |
|
Cr Susan Biggar | 14 |
|
Cr Garry Thompson | 16 |
|
Cr Nick Stavrou | 16 |
|
Conflicts of interest
We require conflicts of interest to be disclosed by councillors, members of delegated committees, Council officers and contractors. The procedures for making disclosures vary depending on the role and circumstances, but they generally involve disclosing the relevant interest in accordance with the Governance Rules and then stepping aside from the relevant decision-making process or from the exercise of the public duty.
During FY2022-23, 17 conflicts of interest were declared at Council and Delegated Committee meetings.
Councillor allowances and expenses
Allowances paid to each councillor during the year are in the table below, along with councillor expenses for FY2022-23.
Councillors are reimbursed for expenses incurred while performing their duties. Expenses can be broken down into the following categories:
- Information and communication
- Accommodation and travel
- Professional development
- Other expenses (including levies and charges, membership fees, minor equipment purchases, general administration, and childcare expenses).
A breakdown of these expenses is available in the complete Annual report.
Councillors | Allowance | Total expenses |
|---|---|---|
Cr Felicity Sinfield (Mayor from 9 December 2022) | $85,727.48 | $10,161 |
Cr Jane Addis (Mayor until 9 December 2022) | $73,440.50 | $1,944 |
Cr Lisa Hollingsworth (Deputy Mayor from 9 December 2022) | $50,752.39 | $5,638 |
Cr Wes Gault (Deputy Mayor until 9 December 2022) | $42,291.98 | $9,479 |
Cr Jim Parke | $36,829.64 | $958 |
Cr Victor Franco | $36,829.64 | $2,522 |
Cr Di Gillies | $36,829.64 | $8,408 |
Cr Cynthia Watson | $33,831.97 | $5,190 |
Cr Susan Biggar | $36,829.64 | $1,057 |
Cr Garry Thompson | $36,829.64 | $1,375 |
Cr Nick Stavrou | $34,226.18 | $2,203 |
Pagination links
Our committees
Our committees
You can find out more about the purpose of each committee and which councillors attend on our Advisory and other committees page.
Audit and risk committee
The Audit and Risk Committee oversees and monitors the effectiveness of Council in carrying out its responsibilities for accountable financial management, good corporate governance, maintaining an effective system of internal control and risk management and fostering an ethical environment.
The committee meets 4 times a year. Recommendations from each Audit and Risk Committee meeting are subsequently reported to and considered by Council.
Internal audit
The following internal audit reviews were conducted as part of the internal audit plan for FY2022-23:
- Asset Management
- Business Continuity Planning
- Legislative Compliance Management
- Follow Up review (commenced)
- Privacy and Third Party (commenced)
- Panel Contractors (commenced)
- Special Charge Scheme (commenced).
External audit
We are audited externally by the Victorian Auditor-General’s Office (VAGO).
Council Advisory Committees
Arts and Culture
Boroondara Arts Advisory Committee update
The Boroondara Arts Advisory Committee has met twice this year, in March and June. Items considered by the councillor committee members included:
- deaccession of specified works
- donations to the Town Hall Gallery Collection
- guiding principles for policy documents.
Boroondara Eisteddfod Advisory Committee update
The Eisteddfod Advisory Committee has met twice this year, in March and May. Items considered by the committee included final preparations and confirmation of details for the start of the 2023 Boroondara Eisteddfod.
Community Planning and Development
Boroondara Community Safety Advisory Committee update
The Boroondara Community Safety Advisory Committee (BCSAC) met 3 times this year, in August, November, and February. The most recent meeting had the following agenda items discussed:
- a presentation about the Glenferrie Oval revitalisation project and how Crime Prevention Through Environmental Design (CPTED) principles inform our projects
- an update on planning for Community Safety Month in October 2023
- an update on our activities related to graffiti management
- an update from Victoria Police about current crime and safety issues in Boroondara
- an update from members about their current activities and emerging priorities.
Boroondara Community Strengthening Grants Assessment Panel update
Recommendations for the 2023-26 Triennial Operational Grants were adopted by Council on 26 June 2023.
The Community Strengthening Grants Review Panel met on twice to review the Small Grant applications. The Panel comprised 3 Councillors, and a report with recommendations was presented to Council on 10 July 2023. The recommended funding allocations focused on new activities and equipment purchases which align with our strategic objectives and priorities to deliver outcomes in alignment with the grant objectives.
Applications for the 2023-24 Annual Community Strengthening Grants opened on Monday 24 April 2023 and closed on Sunday 28 May 2023. Applications are being assessed.
Boroondara Public Health and Wellbeing Advisory Committee update
The Boroondara Public Health and Wellbeing Advisory Committee (BPHWAC) met 3 times this year, in September, November, and March. The most recent meeting had the following agenda items discussed:
- a progress report on our alcohol harm community profile research project
- a discussion on our initiatives in the healthy eating space
- a presentation discussion on our Municipal Public Health and Wellbeing Annual Action Plan 2023-24 and Women’s Health Week initiatives
- information sharing by members.
Community Disability Advisory Committee
The Boroondara Community Disability Advisory Committee (BCDAC) met 3 times this year, in September, November, and February. The most recent meeting had the following agenda items discussed:
- ways to improve disability inclusion in Library Services
- the draft Boroondara Disability Access and Inclusion Plan 2023-27
- the Public Realm Asset Manual.
Health and Wellbeing Services
Boroondara Early Years Advisory Committee update
The Early Years Advisory Committee has been dissolved. The Early Years and Middle Years Partnership Forum has commenced with a range of community agencies. The Early and Middle Years Partnership Forum was held on Tuesday 22 August 2023.
Liveable Communities
Marketplace Development Fund (MDF) update
The MDF meets regularly to determine on expenditure to promote Camberwell on Sundays. They met 5 times this year, in July, September, November, February and May. This year expenditure has been allocated to assemble to deliver an annual marketing program including a series of articles for social media channels and 4 events during the year.