Council Budget 2025–26
Council Budget 2025–26
We’ve prepared our Budget 2025–26 in line with our commitment to sustainable budgeting, responsible financial management and the Victorian Government’s rate cap for 2025–26. Our budget also supports our community vision and priority themes in the Boroondara Community Plan 2021–2031.
Our budget aims to maintain and improve services and infrastructure, as well as deliver projects and services that our community values.
We predict that this budget will have a surplus of $20.66 million. This is an increase of $866,000 from the 2024–25 forecast.
In 2025–26, we’ll continue to invest in the delivery of services to our community, including:
- libraries
- health and wellbeing services
- parks and gardens, biodiversity and street trees maintenance
- arts and cultural services and events
- planning, development and building controls
- maintenance of the city’s infrastructure.
We will also continue to invest in our infrastructure assets. This includes renewal works and new works for:
- roads
- footpaths and bicycle paths
- drainage
- community buildings.
In October 2024, you elected your Council representatives. Councillors are working to advocate for your interests and this budget captures new perspectives, focusing on:
- healthy futures for young people
- building climate resilience
- reducing emissions.
We are confident the Budget 2025–26 responds to our communities’ priorities and shows how we’re creating ‘a sustainable and inclusive community’.
The online version of the Council Budget 2025–26 has been simplified and edited for web.
Download the Council Budget 2025–26
Table of contents
Total revenue and spending
Total revenue and spending
| Description | 2025–26 | 2024–25 |
|---|---|---|
| Total revenue | $300.52 million | $295.46 million |
| Total spending | $279.85 million | $275.67 million |
| Account result – surplus/(deficit) | $20.66 million | $19.80 million |
Underlying operating result – surplus/(deficit) (This is an important measure of financial sustainability because it excludes capital income from being allocated to cover operating expenses) | $14.10 million | $11.90 million |
We’ve adjusted the 2025–26 surplus result by $6.56 million as this relates to capital grants and open space contributions.
We’ve adjusted the 2024–25 surplus result by $7.90 million as this relates to capital grants and open space contributions.
Pagination links
Key investments for 2025–26
Key investments for 2025–26
Our 2025–26 Budget focuses on investing in high-quality, sustainable and inclusive community services and facilities.
This includes:
- $28.1 million over the next 4 years for the Michael Tuck Stand redevelopment
- $6.8 million over the next 3 years for the Kew Library redevelopment
- $2.28 million for the Hawthorn Library project.
Investments into preserving and increasing green space
We’re investing in our sportsgrounds, which includes:
- $3.14 million for sportsground reconstruction program
- $200,000 for minor sportsground improvements
- $658,000 for the Sportsground Infrastructure Renewal Program
We understand there’s limited open space in our community for recreation. We will invest $800,000 each year into our Open Space Acquisition Fund, which allows us to purchase additional open space when there’s an opportunity.
Investments into maintaining our infrastructure
We’ll invest:
- $6.99 million for drainage renewal
- $2.01 million for footpath and cycleway renewal
- $13.78 million for road renewal
- $8.32 million other community building renewal works and minor works across many other properties under Council stewardship.
Investments into services
We'll invest:
- $10.98 million to provide library services 7 days a week
- $10.41 million on health and wellbeing services, including immunisation, youth and recreation services
- $25.65 million for parks and gardens, biodiversity and street trees maintenance
- $4.49 million on arts and cultural services and events
- $13.53 million for planning, development and building controls
- $14.78 million for maintenance of the city’s infrastructure.
Pagination links
What affected our 2025–26 Budget
What affected our 2025–26 Budget
External influences
Victorian Government
The Victorian Government influence on our budget includes:
- the Victorian Government’s rate cap increase of 3%.
- the Victorian Government waste levy is expected to increase from $132.76 to $169.79 per tonne in 2025–26. The waste levy changes are part of the Victorian Government’s Recycling Victoria package. This is a 10-year action plan to encourage more recycling and reduce waste going to landfill.
- the Emergency Services and Volunteers Fund (ESVF) that we collect for the Victorian Government. This replaces the Fire Services Property Levy (FSPL) from 1 July 2025.
- ongoing cost shifting. This happens when a local government provides a service to the community on behalf of the Victorian or Australian Government. Over time, the cost for providing the service goes up, but the funding a local government receives doesn’t match it.
Grant funding
We’ve received capital works grant funding of $1.51 million, with the most significant being $950,000 from the Australian Government for the Roads to Recovery Program funding covering roads pavement renewal works.
Internal influences
Internal influences on our budget include projects that aren’t finished or haven’t started yet. This can be because of planning issues, weather delays or a longer consultation with the community.
Employee costs are another internal influence. These are mostly driven by Council’s Enterprise Agreement. We've included an annual increase of 3% for all costs related to employees, such as wages, Work Cover and superannuation. In 2025–26 the compulsory Superannuation Guarantee Scheme (SGC) will also increase from 11.50% to 12%.
Waste collection costs will also increase in 2025–26 by roughly 7%. This is linked directly to the cost of providing the waste services.
Pagination links
How the Budget supports our Community Plan
How the Budget supports our Community Plan
In this section, we list the 7 themes of the Boroondara Community Plan and the services that fall under each of these themes. We detail the amount that each service costs, the amount we’ll make in revenue and the total net cost of that service.
Theme 1 – Community, Services and Facilities
Arts and Culture
Expenditure: $4,270,000
Revenue: $777,000
Net cost: $3,493,000
Asset Management
Expenditure: $3,714,000
Revenue: $0
Net cost: $3,714,000
Capital Projects
Expenditure: $1,634,000
Revenue: $31,000
Net cost: $1,603,000
Civic Services
Expenditure: $7,055,000
Revenue: $5,593,000
Net cost: $1,462,000
Community Development
Expenditure: $7,367,000
Revenue: $1,332,000
Net cost: $6,035,000
Infrastructure Maintenance
Expenditure: $15,065,000
Revenue: $135,000
Net cost: $14,930,000
Library Services
Expenditure: $10,937,000
Revenue: $1,285,000
Net cost: $9,652,000
Health and Wellbeing
Expenditure: $10,308,000
Revenue: $4,554,000
Net cost: $5,754,000
Theme 2 – Parks and Green Spaces
Landscape and Design
Expenditure: $245,000
Revenue: $0
Net cost: $245,000
Open Space
Expenditure: $21,438,000
Revenue: $2,013,000
Net cost: $19,425,000
Theme 3 – The Environment
Environmental Sustainability
Expenditure: $2,050,000
Revenue: $250,000
Net cost: $1,800,000
Drainage Management
Expenditure: $699,000
Revenue: $95,000
Net cost: $604,000
Open Space
Expenditure: $1,053,000
Revenue: $0
Net cost: $1,053,000
Waste and Recycling
Expenditure: $31,157,000
Revenue: $2,046,000
Net cost: $29,111,000
Theme 4 – Neighbourhood Character and Heritage
Asset Protection
Expenditure: $1,559,000
Revenue: $3,144,000
Net cost: $1,585,000
Strategic Planning and Placemaking
Expenditure: $2,127,000
Revenue: $0
Net cost: $2,127,000
Building Services
Expenditure: $2,823,000
Revenue: $1,693,000
Net cost: $1,130,000
Urban Planning
Expenditure: $7,735,000
Revenue: $3,035,000
Net cost: $4,700,000
Theme 5 – Moving Around
Civic Services
Expenditure: $6,727,000
Revenue: $16,356,000
Net cost: $9,629,000
Road Maintenance and Repair
Expenditure: $1,438,000
Revenue: $100,000
Net cost: $1,338,000
Traffic and Transport
Expenditure: $1,853,000
Revenue: $0
Net cost: $1,853,000
Theme 6 – Local Economy
Local Economies
Expenditure: $4,914,000
Revenue: $2,959,000
Net cost: $1,955,000
Minor shopping centre upgrade and maintenance
Expenditure: $371,000
Revenue: $0
Net cost: $371,000
Theme 7 – Governance and Leadership
Chief Financial Office
Expenditure: $7,126,000
Revenue: $2,686,000
Net cost: $4,440,000
Council Operations
Expenditure: $403,000
Revenue: $0
Net cost: $403,000
Councillors, Chief Executive Officer, Executive Management and support staff
Expenditure: $3,108,000
Revenue: $0
Net cost: $3,108,000
Customer Support and Corporate Information
Expenditure: $8,528,000
Revenue: $0
Net cost: $8,528,000
Digital
Expenditure: $1,902,000
Revenue: $0
Net cost: $1,902,000
Digital Experience
Expenditure: $1,445,000
Revenue: $0
Net cost: $1,445,000
Governance and Legal
Expenditure: $6,881,000
Revenue: $34,000
Net cost: $6,847,000
Information Technology
Expenditure: $14,644,000
Revenue: $0
Net cost: $14,644,000
People, Culture and Development
Expenditure: $4,948,000
Revenue: $0
Net cost: $4,948,000
Strategic Communications
Expenditure: $4,287,000
Revenue: $0
Net cost: $4,287,000
Strategy and Performance
Expenditure: $2,584,000
Revenue: $0
Net cost: $2,584,000
Pagination links
Summary of our financial position
Summary of our financial position
This summary provides important information about our:
- rate increase
- operating result
- service levels
- cash and investments
- capital works
- financial sustainability.
The following graphs show the 2024–25 forecast actual, which is marked with an F before the date.
The graphs also show the budget for 2025–26, 2026–27, 2027–28 and 2028–29. These are marked with a B before the date.
Rate percentage increases
In 2025–26, rates will increase by 3%.
Total rates and charges (including waste and interest) increased to $230.82 million (4.53%), including $1.20 million generated from supplementary rates on new and redeveloped properties. Special rates and charges levied through special rate schemes will total $1.63 million.
The Victorian Government introduced a cap on rate increases from 2016–17. The cap for 2025–26 has been set at 3% by the Minister for Local Government. Future years are estimated using Department of Treasury and Finance forecasts of the consumer price index.
In 2025–26 waste service charges will increase on average by 7.7%. The Victorian Government waste levy is expected to increase from $132.76 to $169.79 per tonne in 2025–26.
You can find out more on our Rates 2025–26 page.
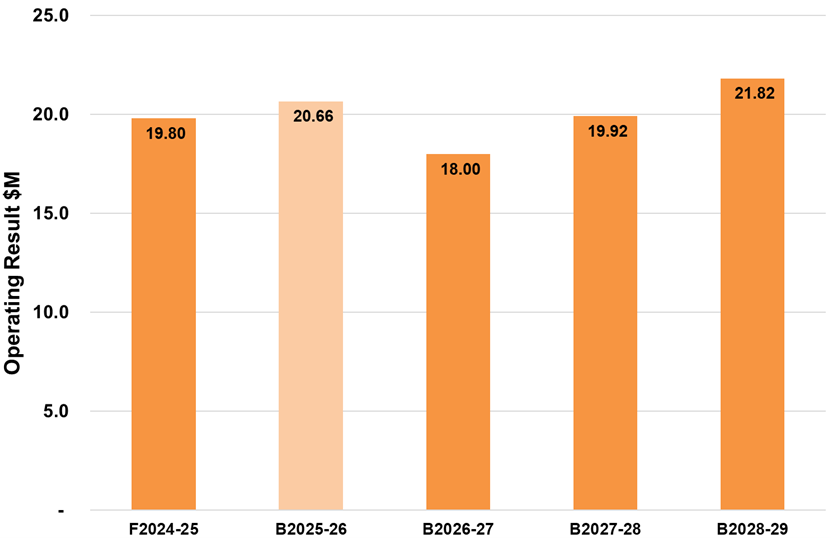
Operating result
The operating result recognises all revenue and spending for Council to operate and includes non-cash items like depreciation.
We expect our operating result for the 2025–26 year to be a surplus of $20.66 million. This is a $866,000 increase from the forecast surplus result of $19.80 million for 2024–25.
The operating result and future years can change depending on the number of priority projects planned.
Our adjusted underlying result is a surplus of $14.10 million, which is an increase of $2.20 million over 2024–25. The adjusted underlying result doesn’t include items such as capital grants, non-cash contributions and cash capital contributions.
The forecast underlying result for the 2024–25 year is a surplus of $11.90 million. The 2024–25 adjusted underlying result doesn’t include capital grants and contributions totalling $7.90 million.
When we talk about a surplus or deficit, this isn’t a measure of ‘profit’. It tells us about the capacity we have to fund future capital works.
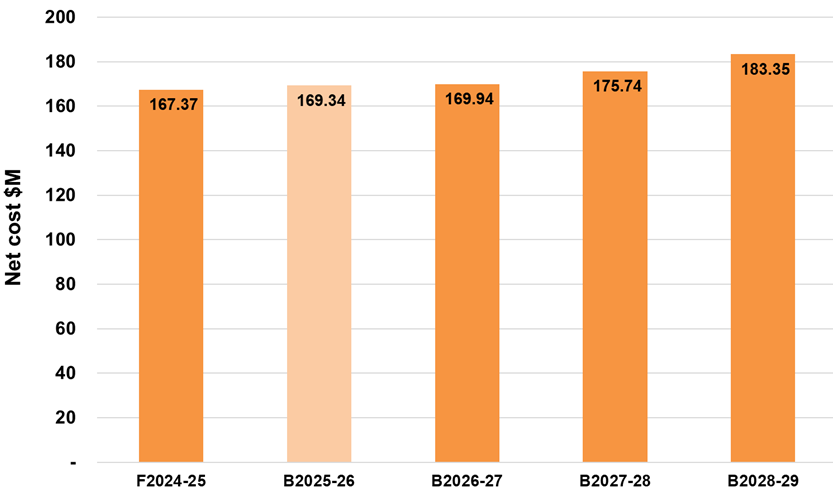
Services we deliver to the community
The net cost of services we deliver to the community includes the net costs to run services after receiving income from them, as well as net spending on priority projects. For the 2025–26 year, we expect the net cost of services we deliver to be $169.34 million. This is an increase of $1.97 million over 2024–25.
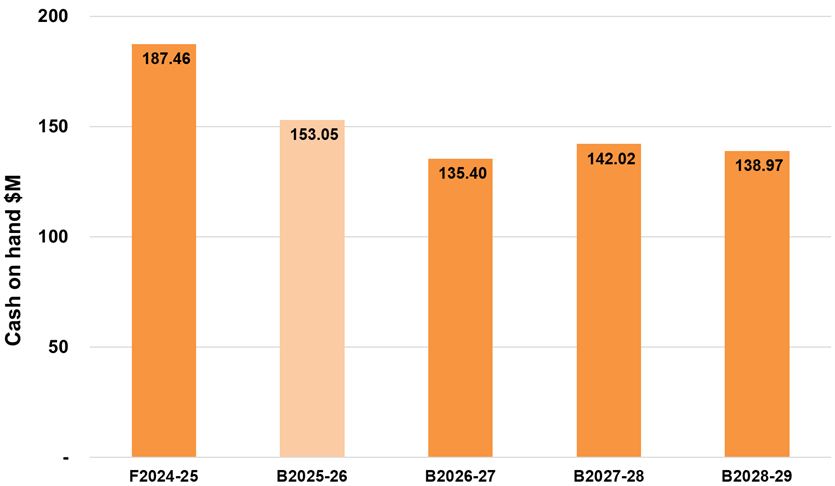
Cash and investments
We use cash and investments to fund the Capital Works Program and repay existing borrowings.
In our budget, we’ve decreased cash and investments by $34.41 million to $153.05 million for the year ending 30 June 2026.
We’re proposing to borrow $9.50 million to fund the purchase of 17 side loader waste trucks during the 2025–26 financial year.
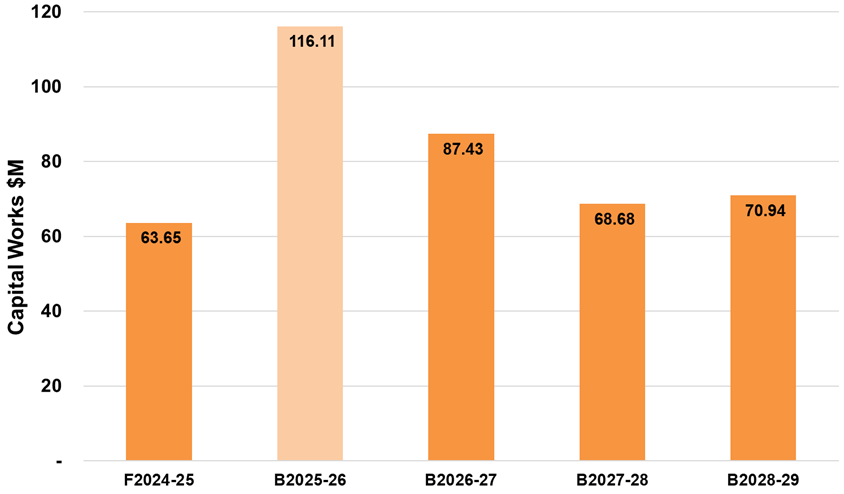
Capital Works Program
Our commitment to capital works will reach $116.11 million for the 2025–26 financial year. Of this amount, $3.68 million is for commitments we carried over from the 2024–25 year. These commitments are fully funded from the 2024–25 Budget.
Successful grant applications have provided capital funding of $1.51 million of capital funding.
To achieve our commitment to capital works, we’ve committed to spend $74.68 million for renewal projects. We have also committed to spend $41.45 million for new, upgrade and expansion projects. This includes commitments we have carried over.
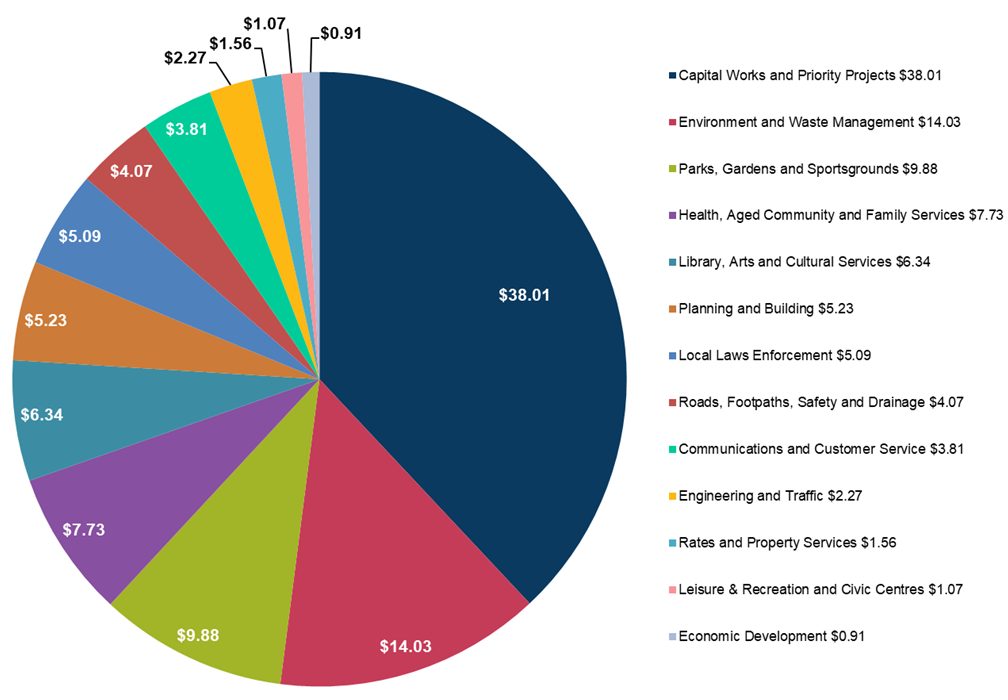
How we spend money across services
We’ve broken down how we spend money across the main services we deliver. For every $100 we spend:
- $38.01 is for Capital works and priority projects
- $14.03 is for Environment and waste management
- $9.88 is for Parks, gardens and sportsgrounds
- $7.73 is for Health, aged community and family services
- $6.34 is for Library, arts and cultural services
- $5.23 is for Planning and building
- $5.09 is for Local laws enforcement
- $4.07 is for Roads, footpaths, safety and drainage
- $3.81 is for Communications and customer service
- $2.27 is for Engineering and traffic
- $1.56 is for Rates and property services
- $1.07 is for Leisure and recreation and civic centres
- $0.91 is for Economic development.
Pagination links
Financial statements
Financial statements
Our financial statements include projections for the 4 years ending 30 June 2029.
They are prepared in line with the Local Government Act 2020 and the Local Government (Planning and Reporting) Regulations 2020.
Comprehensive Income Statement
Find information about the income and expenses for the 4 years ending 30 June 2028.
Balance Sheet
Find information about:
- current assets
- non-current assets
- current liabilities
- non-current liabilities.
Statement of Changes in Equity
Find information about the:
- balance at beginning of the financial year
- surplus (or deficit) for the year
- net asset revaluation increase (or decrease) of Council’s assets, such as property, infrastructure, plant and equipment
- transfer to or from our other reserves, including our Open Space Reserve, Defined Benefits Superannuation call up fund, Strategic Acquisition Fund and the Drainage Reserve
- balance at end of the financial year.
Statement of Cash Flows
Find information about the cash flows from:
- operating activities
- investing activities
- financing activities.
Statement of Capital Works
Find information about the:
- budget for property projects
- budget for plant and equipment projects
- budget for infrastructure projects
- funding sources, including grants, contributions, asset sales, Council cash and borrowings.
Statement of Human Resources
Find information about our staff expenses and our staff numbers.
Pagination links
How we measure our performance
How we measure our performance
Find out about our current and projected performance for services and finance.
We are required to report on our performance against a common set of indicators. These indicators are in Schedule 4 of the Local Government (Planning and Reporting) Regulations 2020. They give a useful analysis of our financial position and performance.
For example, we looked at the satisfaction level of our community with how Council makes and implements decisions. We measured this satisfaction level by asking our community for a rating out of 100 for our consultation and engagement efforts.
We also looked at performance against other indicators, such as:
- decision making
- participation
- waste diversion
- health and safety
- loans and borrowings
- level of debt
- population
- disadvantage
- workforce turnover.
We’ll report results against these indicators in the Performance Statement of our Annual Report.
Pagination links
Fees and charges 2025–26
Fees and charges 2025–26
We provide a range of services to the Boroondara community. To pay for these services, we either charge a fee to use them or we apply a levy.
Our Pricing Policy makes sure that we set fees in line with activities to support community objectives. These are activities that we wouldn't normally do, however, the Victorian or Australian Government has requested and funded them to meet a certain objective.
When we set fees and charges, we think about:
- people’s ability to pay
- equity in how services are subsidised
- community service obligations
- legal or service agreement limitations, such as building permits or statutory planning fees
- results from benchmarking of similar services.
Our fees and charges also might change throughout the 2025–26 year. However, if fees are set by the Victorian Government, we aren’t able to change them.
Waste management fees
We charge waste management fees to pay for:
- the waste to landfill service
- the food organics and green organics waste service
- the recycling service
- hard-waste collection
- operating the Riversdale Road Transfer Station
- post closure management of the Clayton Landfill
- delivering street sweeping services
- public place waste and recycling services
- bin renewal
- disposing of electronic waste.
We also charge waste management fees to pay for waste collection at:
- public parks
- gardens
- sportsgrounds
- community buildings.
In our 2025–26 Budget, we’re proposing an average increase of 5.6% for waste charges in Boroondara, which factors in the Victorian Government waste levy. This levy is part of the Victorian Government's Recycling Victoria package, which is a 10-year action plan to encourage more recycling and reduce waste to landfill.
The Victorian Government waste levy is $169.79 per tonne in 2025–26.
Waste bin charges for 2025–26
| Household waste bin size (landfill) | 2024–25 charge | 2025–26 charge |
|---|---|---|
| Waste environment levy residential and other | $137 | $145 |
| Waste environment levy commercial | $137 | $145 |
| 80-litre and minimum waste charge residential and other | $300 | $317 |
| 80-litre commercial | $300 | $317 |
| 120-litre residential and other | $545 | $576 |
| 120-litre commercial | $545 | $576 |
| 240-litre (only for residential properties with 4 or more people in a household) | $1,327 | $1,399 |
| 240-litre commercial (only for commercial properties) | $1,327 | $1,399 |
| 240-litre concession (concessional fee for residential properties with a specific medical condition) | $1,085 | $1,145 |
Pagination links
Rates and Charges 2025–26
Rates and Charges 2025–26
Visit Pay your rates for information on paying your rates notice.
Rate percentage increases
The Local Government Act 2020 requires us to have a Revenue and Rating Plan. This is a plan for how we’ll generate income to deliver the Council Plan, programs and services, and capital works commitments for the next 4 years.
Our rates and charges are an important source of revenue. They make up 77% of the total revenue we'll receive in 2025-26.
The Minister for Local Government announced that the average property rate cap for 2025–26 will rise by 3%. We won’t be asking for any changes to this rate cap.
Future years are estimated using the Department of Treasury and Finance forecasts of the consumer price index. However, we’re taking a conservative approach to the rate cap and set this at 2.5% for future years.
| Year | Rate increase % |
|---|---|
| 2026 | 3.0% |
| 2027 | 2.5% |
| 2028 | 2.5% |
| 2029 | 2.5% |
| 2030 | 2.5% |
Forecast of our rates and charges
The table below is an overview of our rates and charges. It shows what we forecast in 2024–25 compared to the actual 2025–26 budget.
| Type or class of land | Forecast actual 2024–25 | Budget 2025–26 | Change in dollars | Change in percentage |
|---|---|---|---|---|
| General rates | $183,269,653 | $190,353,631 | $7,083,978 | 3.7% |
| Supplementary rates and adjustments | $900,000 | $1,200,000 | $300,000 | 25% |
| Waste management charge | $36,604,000 | $39,414,000 | $2,810,000 | 7.7% |
| Interest on rates and charges | $800,000 | $900,000 | $100,000 | 11.1% |
| Special rate schemes | $1,547,994 | $1,627,837 | $79,843 | 4.9% |
| Less early payment discount | –$1,130,437 | –$1,106,898 | $23,539 | –2.1% |
| Cultural Recreation charges | $58,199 | $59,719 | $1,520 | 2.5% |
| Total rates and charges | $222,049,409 | $232,448,289 | $10,398,880 | 4.5% |
Rates and property value
The Valuer General of Victoria took over the rateable property general valuation process on 1 July 2018. It also changed this process to happen every year instead of every 2 years.
Under the Local Government Act 1989, local governments can increase rate revenue through valuations of properties. The Valuer General of Victoria works out and certifies the Capital Improved Value (CIV) of properties. We then use the CIV to work out the rates.
The way rates are charged is the same for residential and business properties.
Pagination links
General revaluation of properties
General revaluation of properties
There will be an increase in the rate in the dollar paid by ratepayers. This will be an increase from 0.012826249 cents in the dollar to 0.012968144 cents in the dollar.
A property in Boroondara at the median residential valuation in 2024 was valued at $1,650,000 with a general rate of $2,116.33. The new median valuation for 2025, according to the Valuer General of Victoria, is $1,650,000 and now attracts a general rate of $2,139.74. This is an increase in 2025–26 of $23.41 per year or $0.45 per week.
It’s important to note that when a revaluation is carried out, the total rate revenue that we receive doesn’t change. We don’t make any extra revenue.
A revaluation can change how the rates between properties are allocated. If the value of a property is higher than the average value for other properties, that property receives a higher rate increase compared to the general rate increase for other properties.
However, if the value of a property changes to become less than average, that property receives a lower rate increase compared to the general rate increase for other properties.
The following tables summarise the valuation changes between the 2024 and 2025 general revaluations for all property types including analysis by suburb.
All property types
| Property type | Number of properties | 2024 CIV | 2025 CIV | CIV % change |
|---|---|---|---|---|
| Residential Vacant Land | 969 | $2,186,210,000 | $2,230,870,000 | 2.04% |
| Houses | 41,036 | $105,698,325,000 | $108,346,385,000 | 2.51% |
| Flats | 1,559 | $1,041,755,000 | $1,000,245,000 | -3.98% |
| Units | 31,933 | $26,204,140,000 | $26,432,065,000 | 0.87% |
| Specialty (Retirement) | 34 | $208,800,000 | $209,300,000 | 0.24% |
| Non-residential – rateable | 5,915 | $8,747,872,500 | $8,566,702,500 | -2.07% |
| Total | 81,446 | $144,087,102,000 | $146,785,567,500 | 1.87% |
Analysis by suburbs – all property types
| Property type | Number of properties | 2024 CIV | 2025 CIV | CIV % change |
|---|---|---|---|---|
| Ashburton | 3,579 | $5,556,895,000 | $5,700,995,000 | 2.59% |
| Balwyn | 6,522 | $12,446,907,500 | $12,599,547,500 | 1.23% |
| Balwyn North | 8,406 | $16,552,390,000 | $17,016,212,500 | 2.80% |
| Camberwell | 10,538 | $20,351,555,000 | $20,685,465,000 | 1.64% |
| Canterbury | 3,414 | $8,513,110,000 | $8,802,115,000 | 3.39% |
| Deepdene | 1,002 | $2,378,380,000 | $2,458,460,000 | 3.37% |
| Glen Iris | 6,567 | $12,405,565,000 | $12,695,155,000 | 2.33% |
| Hawthorn | 14,088 | $19,179,165,000 | $19,623,205,000 | 2.32% |
| Hawthorn East | 8,673 | $12,304,697,000 | $12,590,590,000 | 2.32% |
| Kew | 11,816 | $22,712,917,500 | $22,774,152,500 | 0.27% |
| Kew East | 2,963 | $4,866,840,000 | $4,824,770,000 | -0.86% |
| Mont Albert | 59 | $144,950,000 | $145,700,000 | 0.52% |
| Surrey Hills | 3,846 | $6,673,730,000 | $6,869,200,000 | 2.93% |
| Total | 81,446 | $144,087,102,000 | $146,785,567,500 | 1.87% |
Pagination links
Operating and capital grants
Operating and capital grants
Operating grants
Operating grants from the Victorian and Australian Government help us deliver services to ratepayers. Operating grants can be either:
- recurrent, meaning they are received each year
- non-recurrent, meaning they’re once-off or short term.
For 2025–26, we’ve budgeted a decrease of 10.40% or $1.31 million, compared to the 2024–25 forecast.
There’s a $457,000 decrease in recurrent operating grants. This is because of a reduction in:
- Family and Children related grant funding associated with Maternal and Child Health services of $219,000.
- Building Support funding of $141,000 for cladding enforcement.
- funding of $93,000 for Youth Services.
There’s a $850,000 decrease of non-recurrent operating grants. This is because of a reduction in:
- Family and Children related grant funding associated with kindergartens throughout the municipality of $311,000.
- digitalisation related grant funding to digitalise planning files $194,000.
- funding for streetscapes and transport $123,000.
- funding for Volunteer Services $116,000.
There are less grant funding opportunities available in 2025-26.
Capital grants
Capital grants from the Victorian and Australian Government and community sources help us fund the Capital Works Program.
The amount of capital grants we receive each year can change a lot depending on the type of works in the Capital Works Program.
Capital grants can be either:
- recurrent, meaning they are received each year
- non-recurrent, meaning they are once off or short term.
For 2025–26, we’ve budgeted $1.51 million for capital grants funding. This is a decrease in capital grant funding of $4.10 million compared to 2024–25.
The most significant grants include:
- $950,000 from the Australian Government for the Roads to Recovery Program covering roads pavement renewal works.
- $557,000 from the Department of Education and Training for renewal works at Deepdene Kindergarten.
Pagination links
Priority Projects
Priority Projects
Our Priority Projects program provides funding for short-term projects or pilot initiatives. This allows us to deliver on important issues for the community, while making sure that project funding doesn’t become part of the recurrent operating budget. It’s another example of our commitment to financial sustainability, transparency and accountability.
In 2025–26, we’ve planned Priority Projects for the coming year and provided details for projects over the next 3 years.
The Priority Projects budget for 2025–26 includes projects that support all of our strategic objectives.
Pagination links
Borrowings
Borrowings
Borrowings history
During the 2012–13 financial year, we borrowed $29 million to fund major building works. The borrowings were at a fixed interest rate for 10 years and we were due to repay this in full in 2022–23. However, during the 2022–23 financial year, we reviewed our existing loan portfolio and refinanced the rest of this loan for another 10 years.
We expect to repay all existing borrowings by 2033.
Existing borrowings
During the 2024–25 year, we made $8.46 million in principal repayments on existing borrowings. The cost of servicing these borrowings is $3.03 million. On 30 June 2025, our outstanding borrowings will be $68.76 million.
Future borrowing strategy
Our borrowing strategy is to pay off existing debt over time so that we can look at new borrowings for significant infrastructure projects for the community. This strategy allows us to invest in new infrastructure while paying off our debts.
We will look at different borrowing strategies for each area of planned borrowings as they become due.
Future proposed borrowings
The following table sets out our future proposed borrowings, based on our forecast position on 30 June 2025.
| Financial year ending | New borrowings | Principal paid | Interest expense | Balance 30 June |
|---|---|---|---|---|
| 2025 | 0 | 8,460,000 | 3,025,000 | 68,755,000 |
| 2026 | 9,500,000 | 8,819,000 | 2,941,000 | 69,437,000 |
| 2027 | 0 | 10,386,000 | 2,713,000 | 59,049,000 |
| 2028 | 0 | 10,825,000 | 2,267,000 | 48,224,000 |
| 2029 | 0 | 11,282,000 | 1,803,000 | 36,943,000 |
| 2030 | 0 | 11,759,000 | 1,323,000 | 25,184,000 |
| 2031 | 0 | 12,256,000 | 825,000 | 12,928,000 |
| 2032 | 0 | 10,594,000 | 388,000 | 2,334,000 |
| 2033 | 0 | 2,334,000 | 60,000 | 0 |
| 2034 | 0 | 0 | 0 | 0 |
| 2035 | 0 | 0 | 0 | 0 |
9,500,000 | 86,715,000 | 15,345,000 |
|
Statement of borrowings
Pagination links
Leases in our community
Leases in our community
Under section 115 of the Local Government Act 2020, we have the power to lease any land to any person for a term of 50 years or less. However, this is still subject to any other act and where section 116 of the Local Government Act 2020 applies. If we lease any land to any person subject to any exceptions, reservations, covenants and conditions, it must comply with this section.
We must include any proposal to lease land in a financial year in the budget, where the lease is for one year or more and:
- the rent for any period of the lease is $100,000 or more a year
- the current market rental value of the land is $100,000 or more a year
- for 10 years or more.
If we propose to lease land (subject to the 3 criteria noted above) and that was not included as a proposal in the budget, we must complete a community engagement process in line with our community engagement policy before entering into the lease.
The proposed community leases set out in the table are in line with our Council Assets – Leasing and Licensing Policy 2017 and our Boroondara Community Plan 2021–31.
Our in-house Senior Valuer provides us with market rental valuations. All rentals proposed to be charged are in line with our Council Assets – Leasing and Licensing Policy.