We have outlined a summary of our performance below. You can find more information in our Independent Auditor’s Reports of our Financial Report and Performance Statement at the bottom of this page.
Operating position
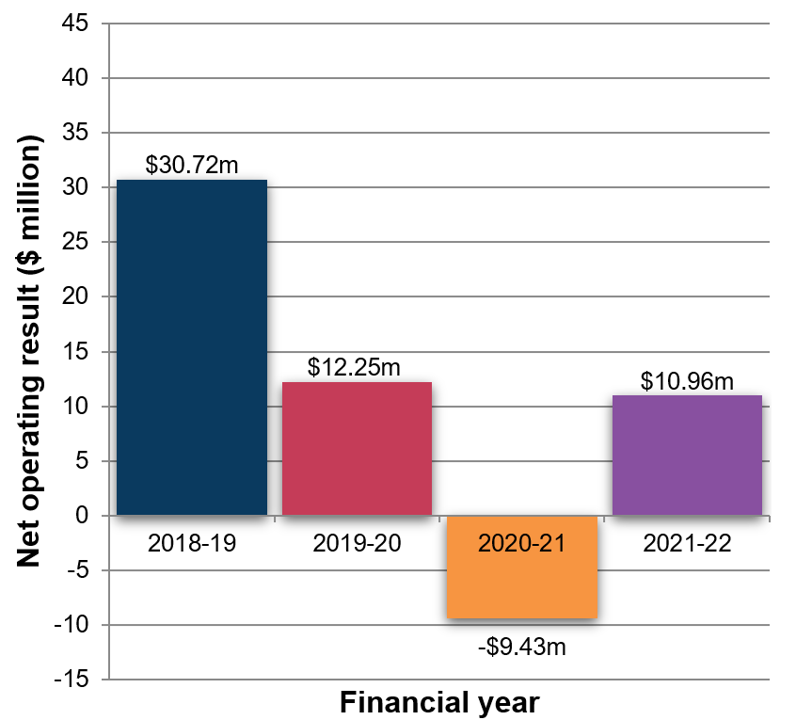
Our net operating surplus for FY2021-22 is $10.96 million. This surplus compares favourably to the original budget surplus of $9.01 million.
The favourable variance is primarily due to the impact of uncertainty surrounding the COVID-19 pandemic on Council’s operations. Whilst there was an unbudgeted impact on revenue, this was offset by reduced costs due to the restrictions causing an inability to progress some operating projects.
Our adjusted underlying result – after removing non-recurrent capital grant income, monetary contributions, and non-monetary asset contributions – is $2.2 million. The adjusted underlying result for FY2021-22 has normalised due to the impacts of COVID- 19 in FY2020-21 and resulting impacts on revenue and expenditure streams.
Liquidity
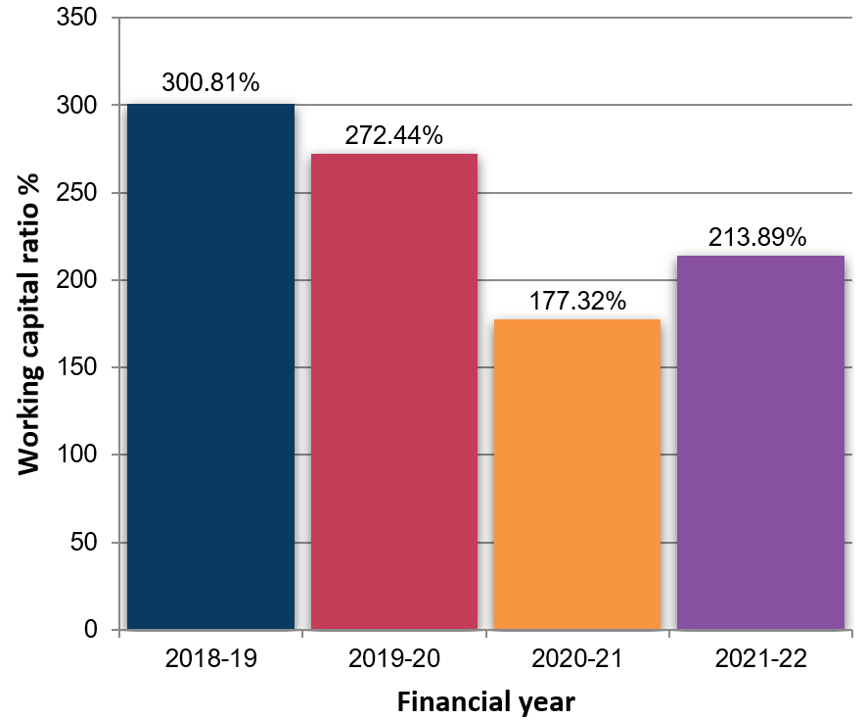
The working capital ratio, which assesses our ability to meet current commitments, is calculated by measuring our current assets as a percentage of current liabilities. Our result of 213.89% indicates a satisfactory financial position.
Obligations
We ensured that we maintained infrastructure assets at expected levels while continuing to deliver the services needed by the community. We invested $49.64 million in renewal works including the renewal of buildings ($24.24 million), roads ($10.23 million) and drainage ($3.7 million) during FY2021-22. This was funded from capital grants of $4.55 million and cash flow from operations of $63.39 million.
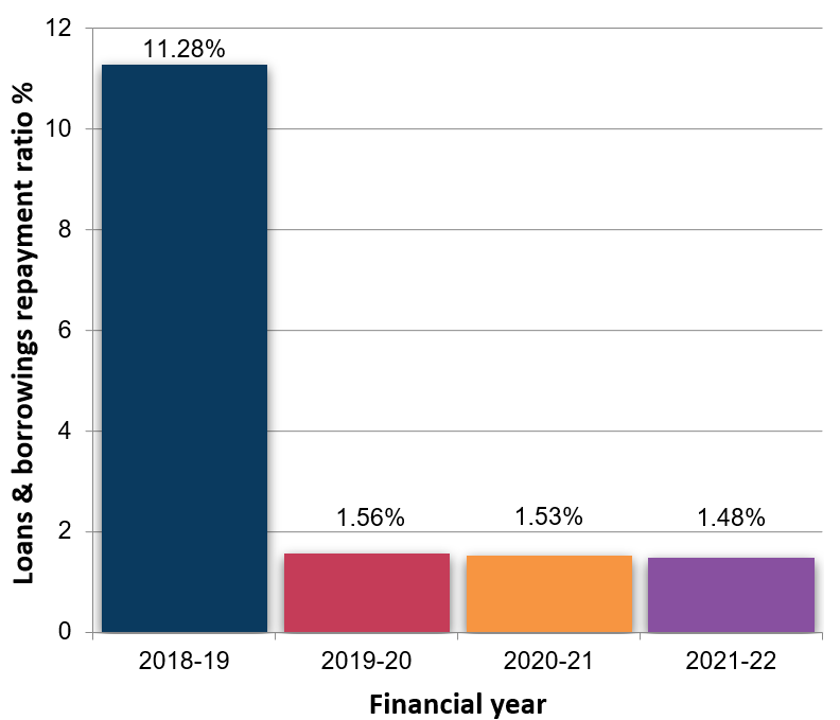
At the end of FY2021-22, our loans and borrowings repayment ratio – measured by comparing interest-bearing loans and borrowing repayments to rate revenue – was 1.48%. The higher ratio of 11.28% in the 2018-19 financial year was due to Council retiring existing debt. A 20-year loan was repaid in full that financial year, and as such the loan and borrowing repayments represented a higher portion of rates revenue for the year.
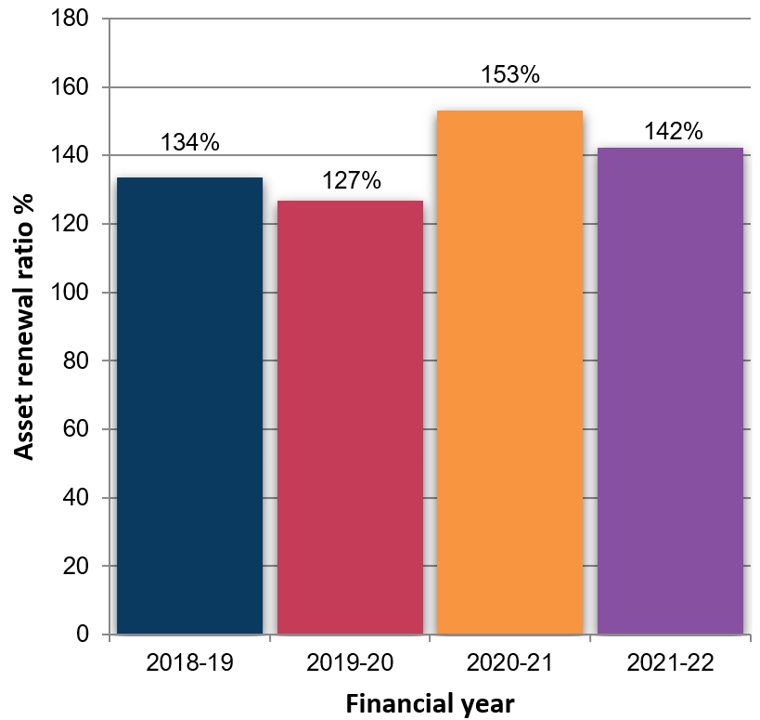
Asset renewal ratio is measured by comparing asset renewal and upgrade expenditure to depreciation and was 142% in FY2021-22. This is due to major renewal projects at Kew Recreation Centre, Canterbury and Community Precinct.
Stability and efficiency
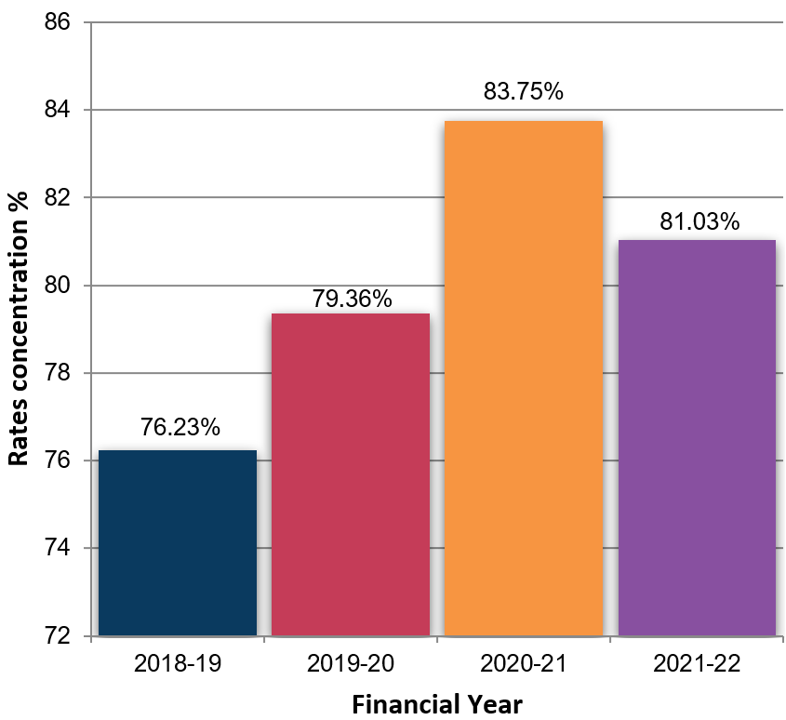
We raise revenue from rates, user fees, fines, grants, and contributions. Our rates concentration, which compares rate revenue to adjusted underlying revenue, was 81.03% for FY2021-22.
We are very reliant on rates as a source of revenue because of statutory restrictions on many fees and charges, and the inadequate increase in the payments from the Victorian Government to adequately fund services.
In the prior year, non-rate revenue declined as an overall proportion of total revenue. In 2020-21, non-rate revenue included user fees and charges and our support package to the community which waived fees for some services to community groups and local businesses. This year, non-rate revenue has increased in proportion to rate revenue resulting in the decline of the rates concentration ratio due to reduced impacts of COVID-19 on our non-rate revenue streams. The average rate per property assessment is $2,065.