Launched in May 2017, our website was co-designed with our community to transform the Boroondara online customer experience. Since the site launched, we are continually working on improvements and are open to hearing your feedback.
You can be among the first to test new website features and help us to improve our website by joining our website testing program. You can join this program by completing our Website testing program form.
The launch of our site was a key milestone in our Customer Experience Improvement Strategy, which is about putting you at the centre of everything we do. You can find out more about this strategy on our Customer Experience Improvement Strategy page.
The results below are from 1 April to 30 June 2023.
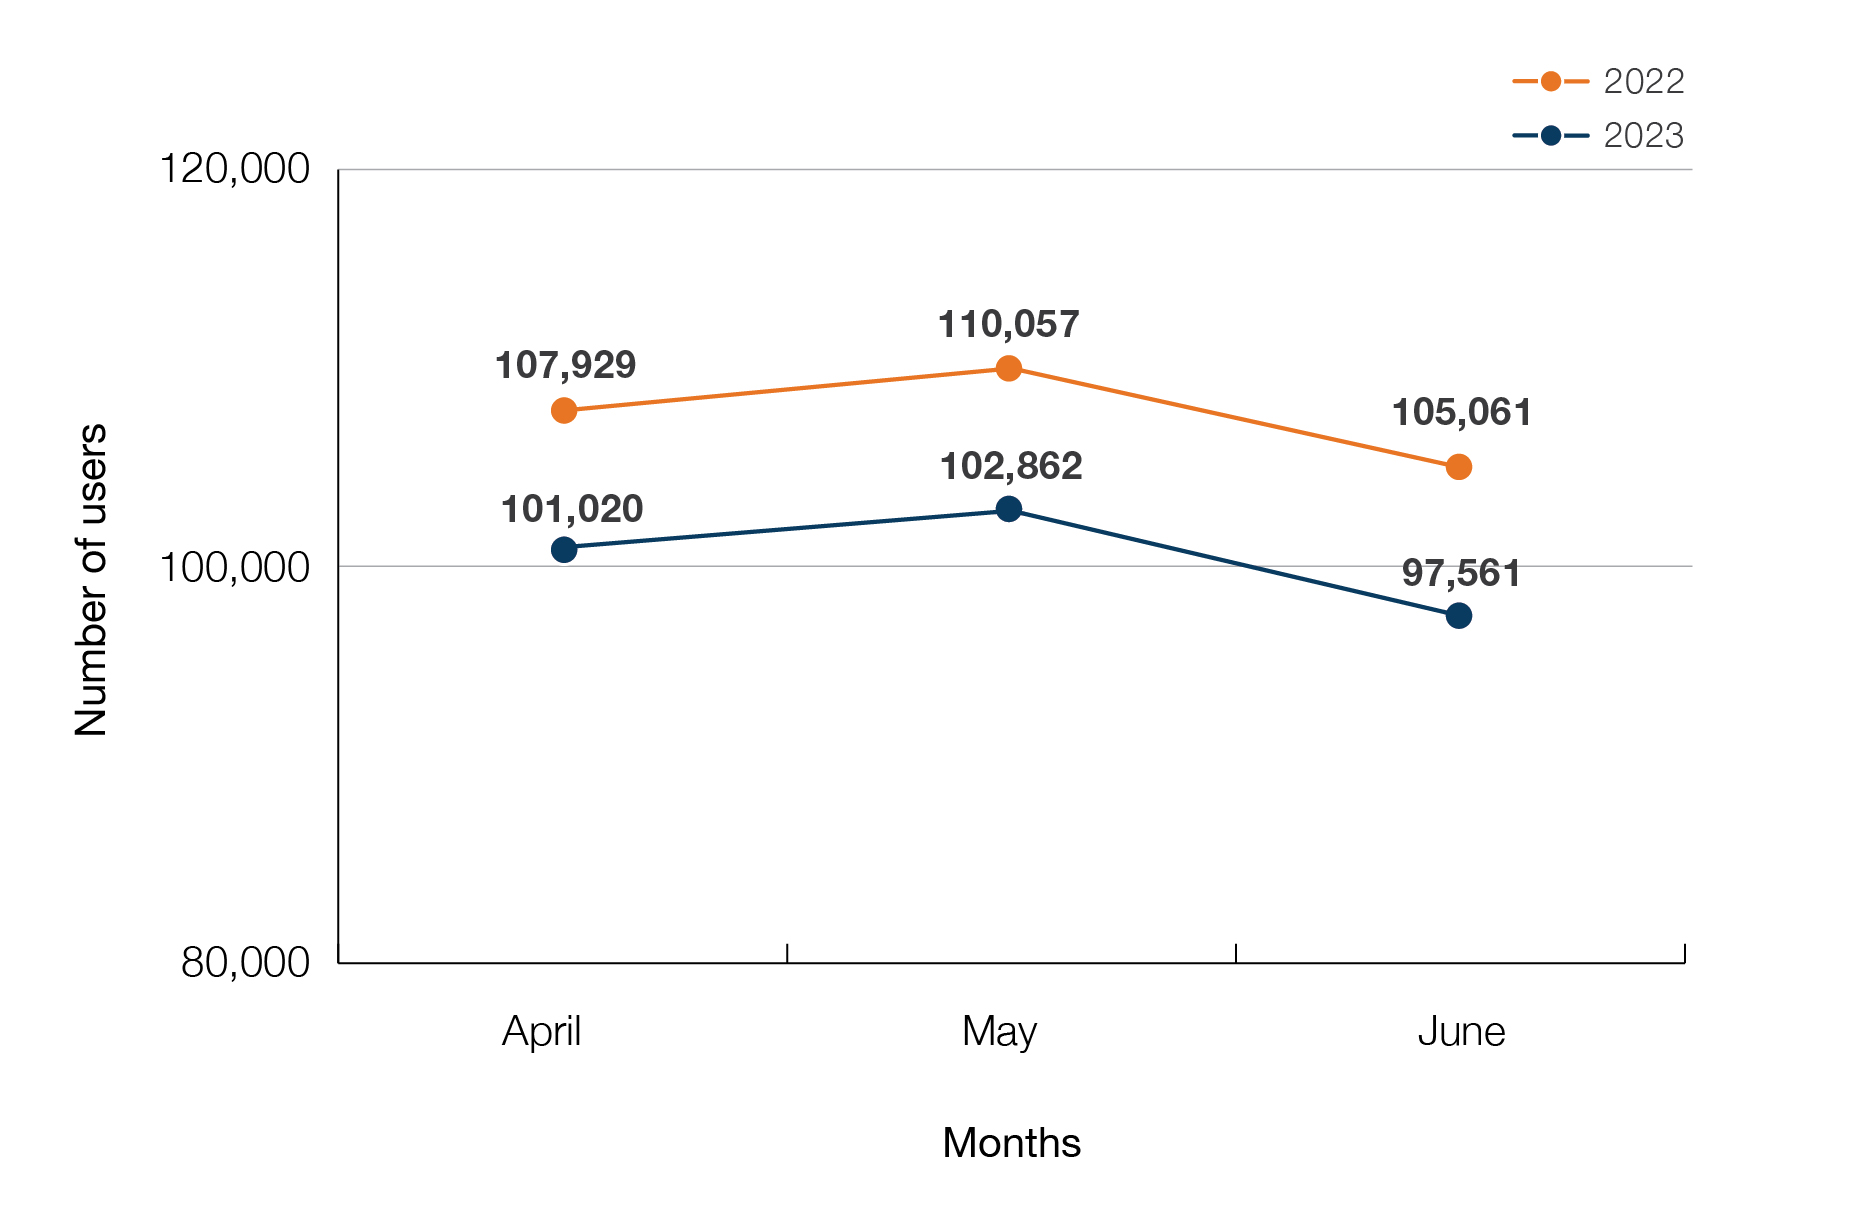
Number of people visiting our website
During this quarter, our website had a total of 281,322 visitors. May was our busiest month for website traffic, with 102,862 visitors.
We saw a decrease of 8,382 (2.89%) visits to the site compared to last quarter, and a decrease of 7,195 users (6.10%) compared to this period in 2022.
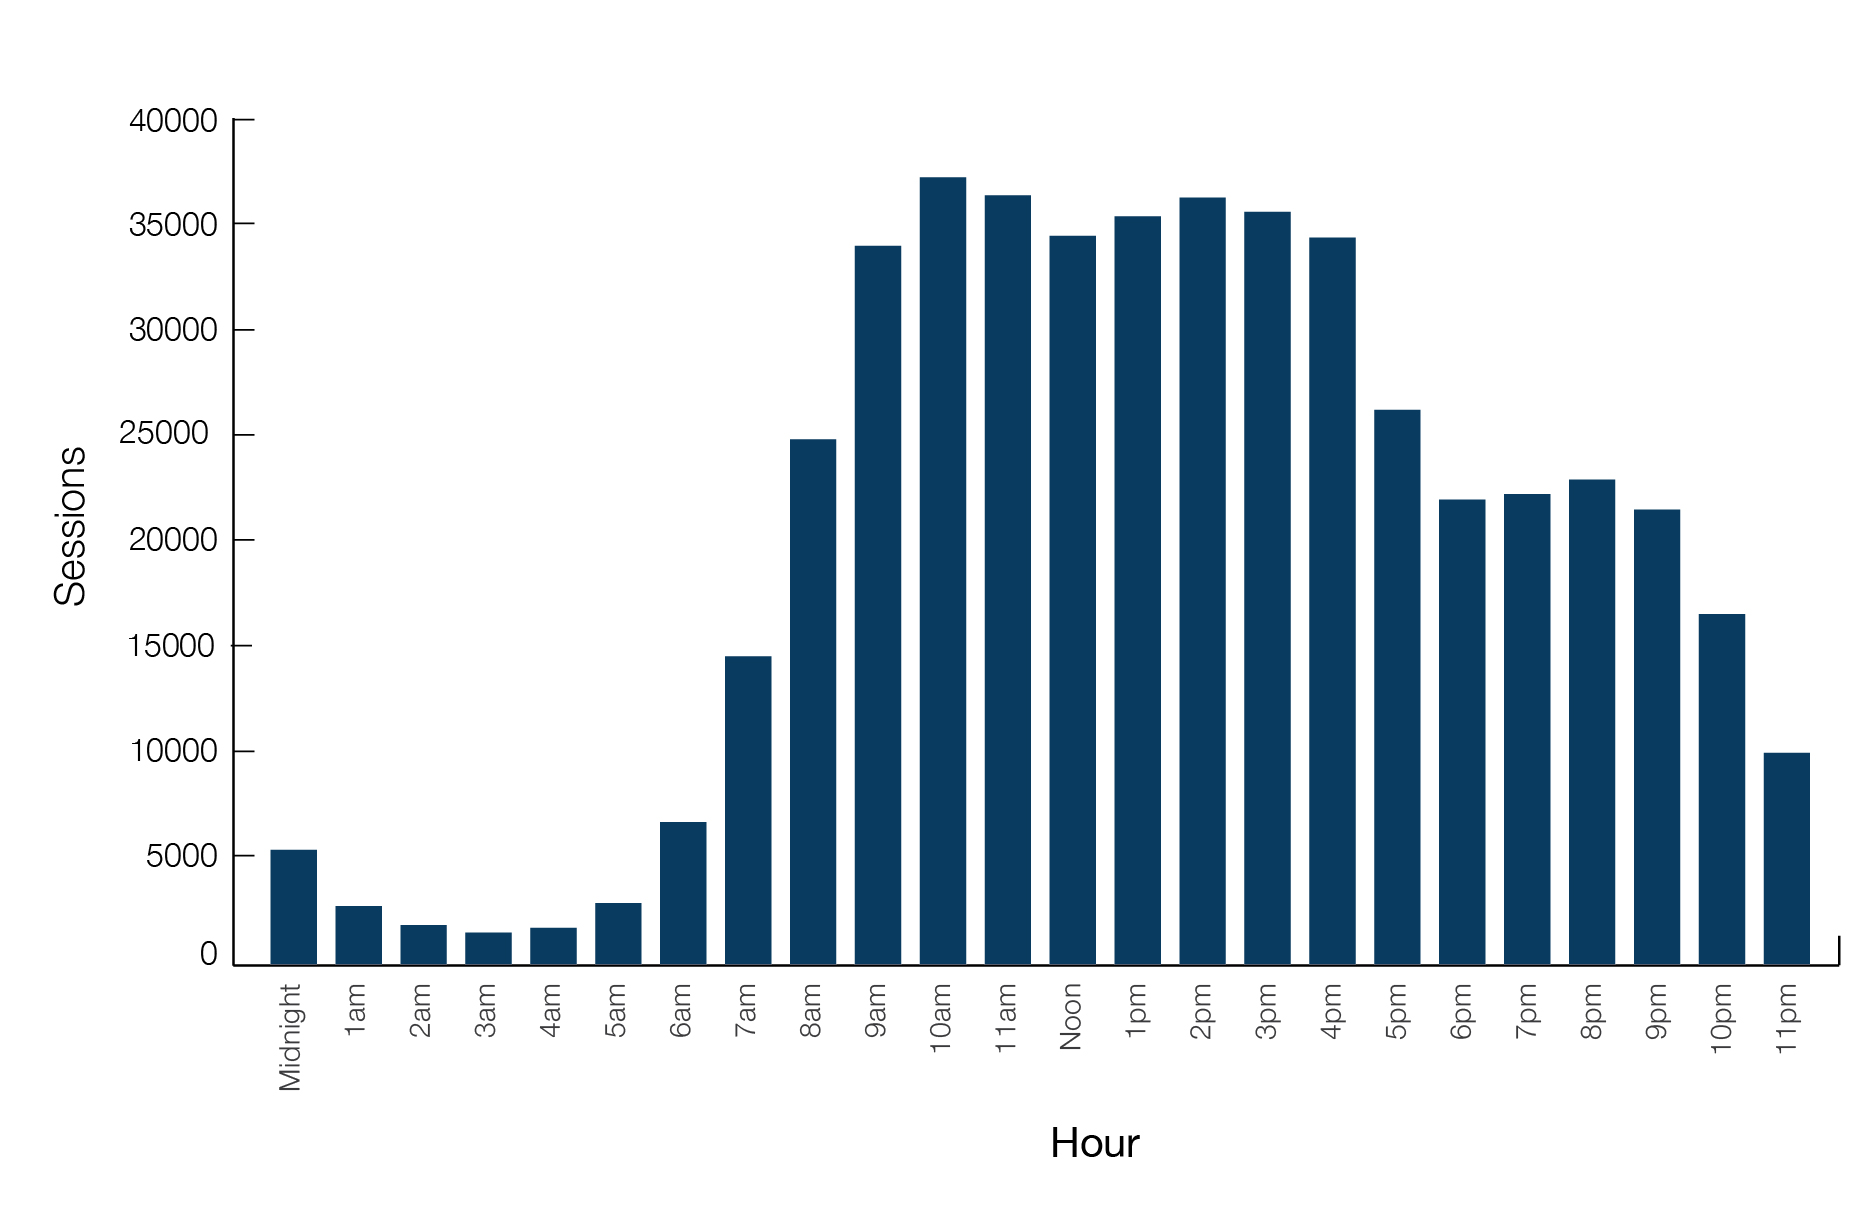
When people are visiting our website
As we continue to increase the options available on our website and improve the experience of our current online tasks, more people are choosing to use our website to self-serve on a 24/7 basis.
During this quarter, 41.80% of our website users visited our website outside business hours, slightly down from last quarter (42.13% of visits outside business hours) and this time last year (43.69%).
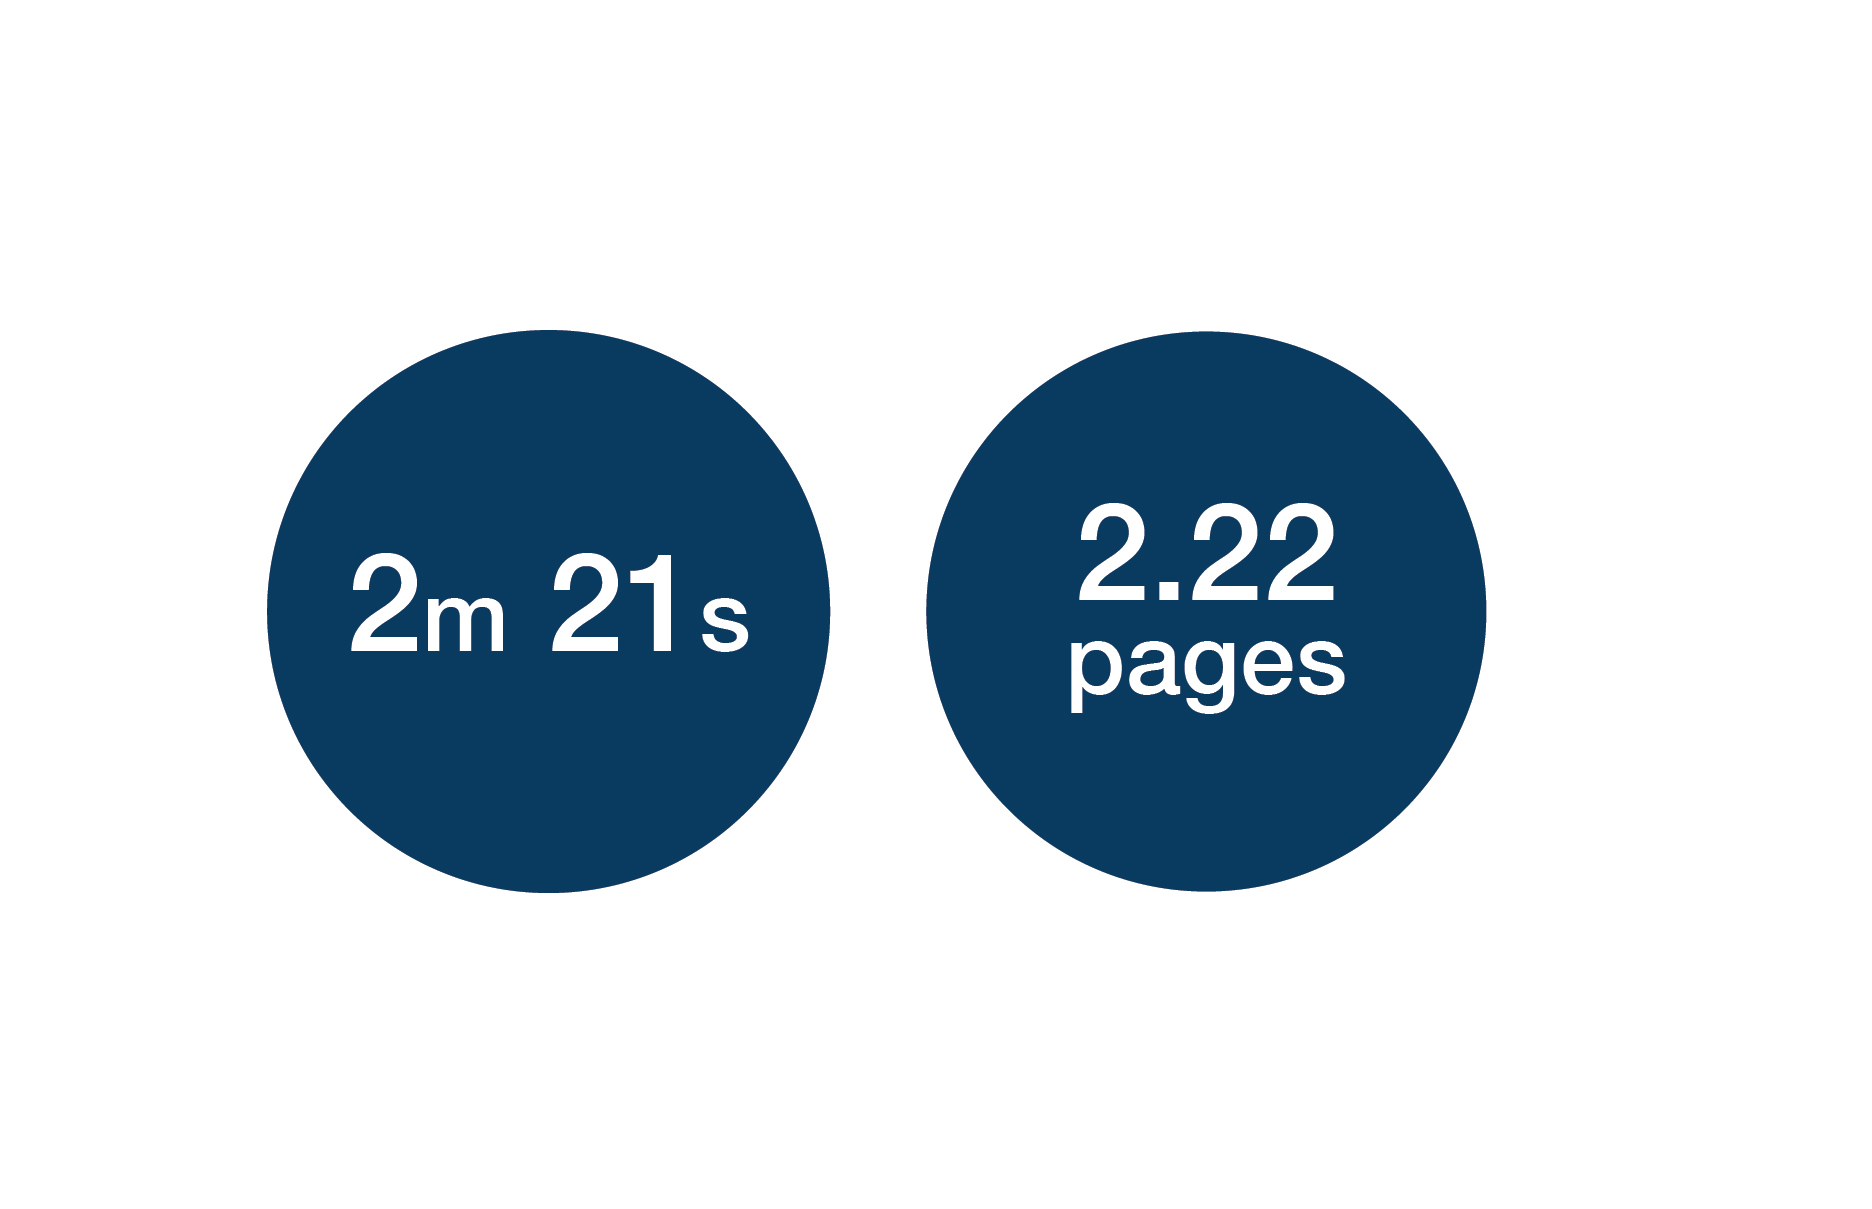
How long people are on our website
Website users spent an average of 2 minutes and 21 seconds on our website this quarter, a 4.8% increase compared to this time last year. While on our website they viewed 2.22 pages, a 1.76% decrease compared to this period last year.
Most popular pages
Our most popular pages this quarter showed that a significant number of website users were looking for information about libraries and their bins and waste disposal. Our top 10 most popular pages were:
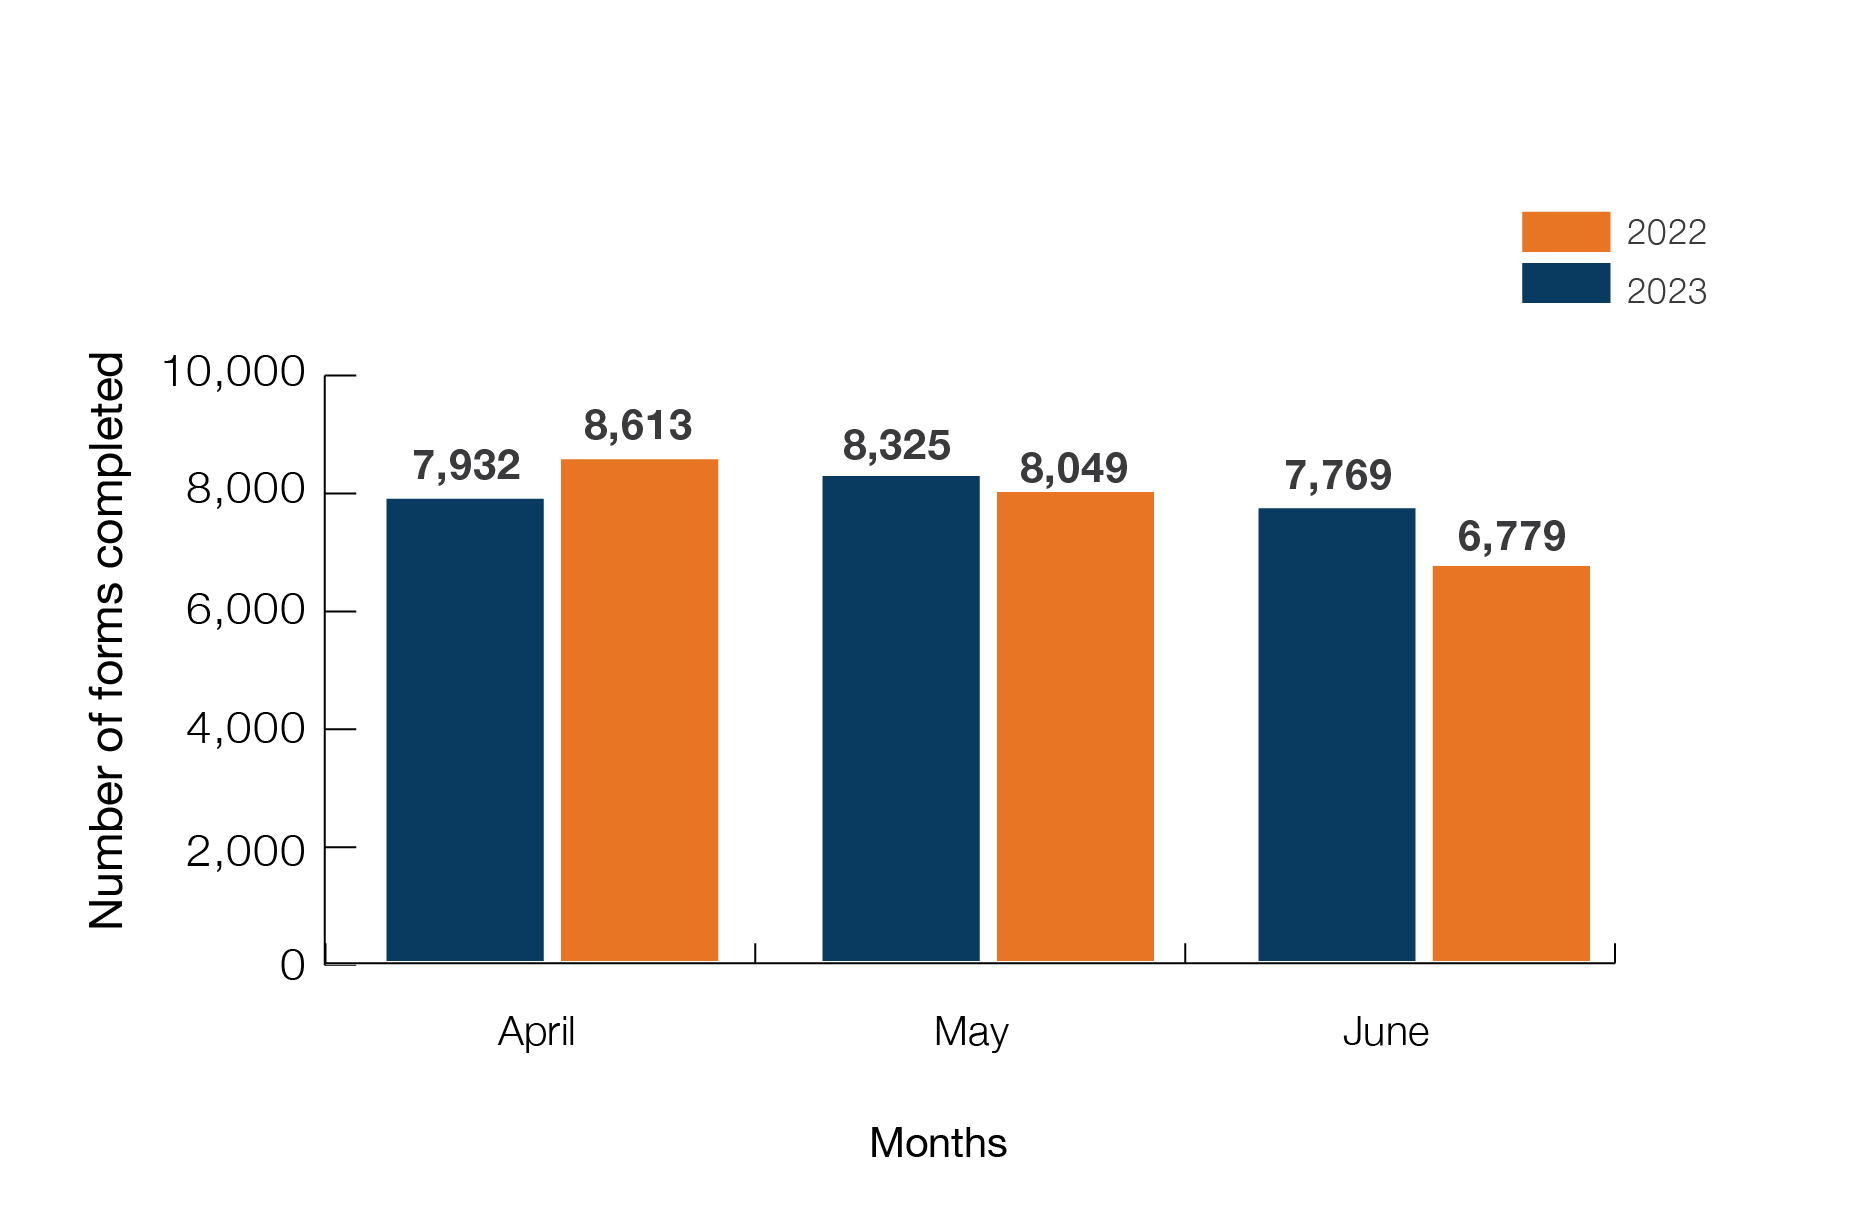
Number of people using digital forms
This quarter, 24,026 forms were completed through our website (compared to 25,911 last quarter). This is 2.5% more than the amount of online forms completed during the same period last year (23,441 forms).
Our 'Book a waste collection' was our most used form this quarter, with 6,504 submissions. Our 'Report a bin problem' form was the second most used form with 2,024 submissions. These 2 forms were also the most popular last quarter and at this time last year.
Satisfaction with digital forms
This quarter, 11,837 people who used our online forms provided us with a satisfaction rating of their experience. Their average satisfaction rating for our digital forms was 4.52 out of 5 stars, compared to 4.55 out of 5 stars last quarter and 4.57 stars this time last year.

Feedback from website users
As part of our digital transformation and ongoing effort to continuously improve our content and services, we encourage you to send us feedback by completing the form at the bottom of most pages on our website.
Here are some of the things you told us about the website last quarter, and some actions we took to improve your experience.
“It made all the information really clear for me and it really helps to know what I need to do.” (Page rating: helpful)
Comment submitted on Enter the Boroondara Literary Awards page.
“Where do I submit feedback on a road, report a problem, suggest an improvement?” (Page rating: unhelpful)
Action taken: We created a new page to make it easier for our community to report different issues to us, including issues with the roads we manage. Visit our Report an issue page.
“The site is easy to navigate and in easily understood language. Thanks.” (Page rating: helpful)
Comment submitted on our Pay a parking fine page.
“Am I in area A or area B? Which one?” (Page rating: unhelpful)
Action taken: We have made it easier to find your bin day by improving our address look-up. You can now enter your address to find out what day your bins are collected, the next collection date and if you live in area A or area B. Visit our Find your bin day page.