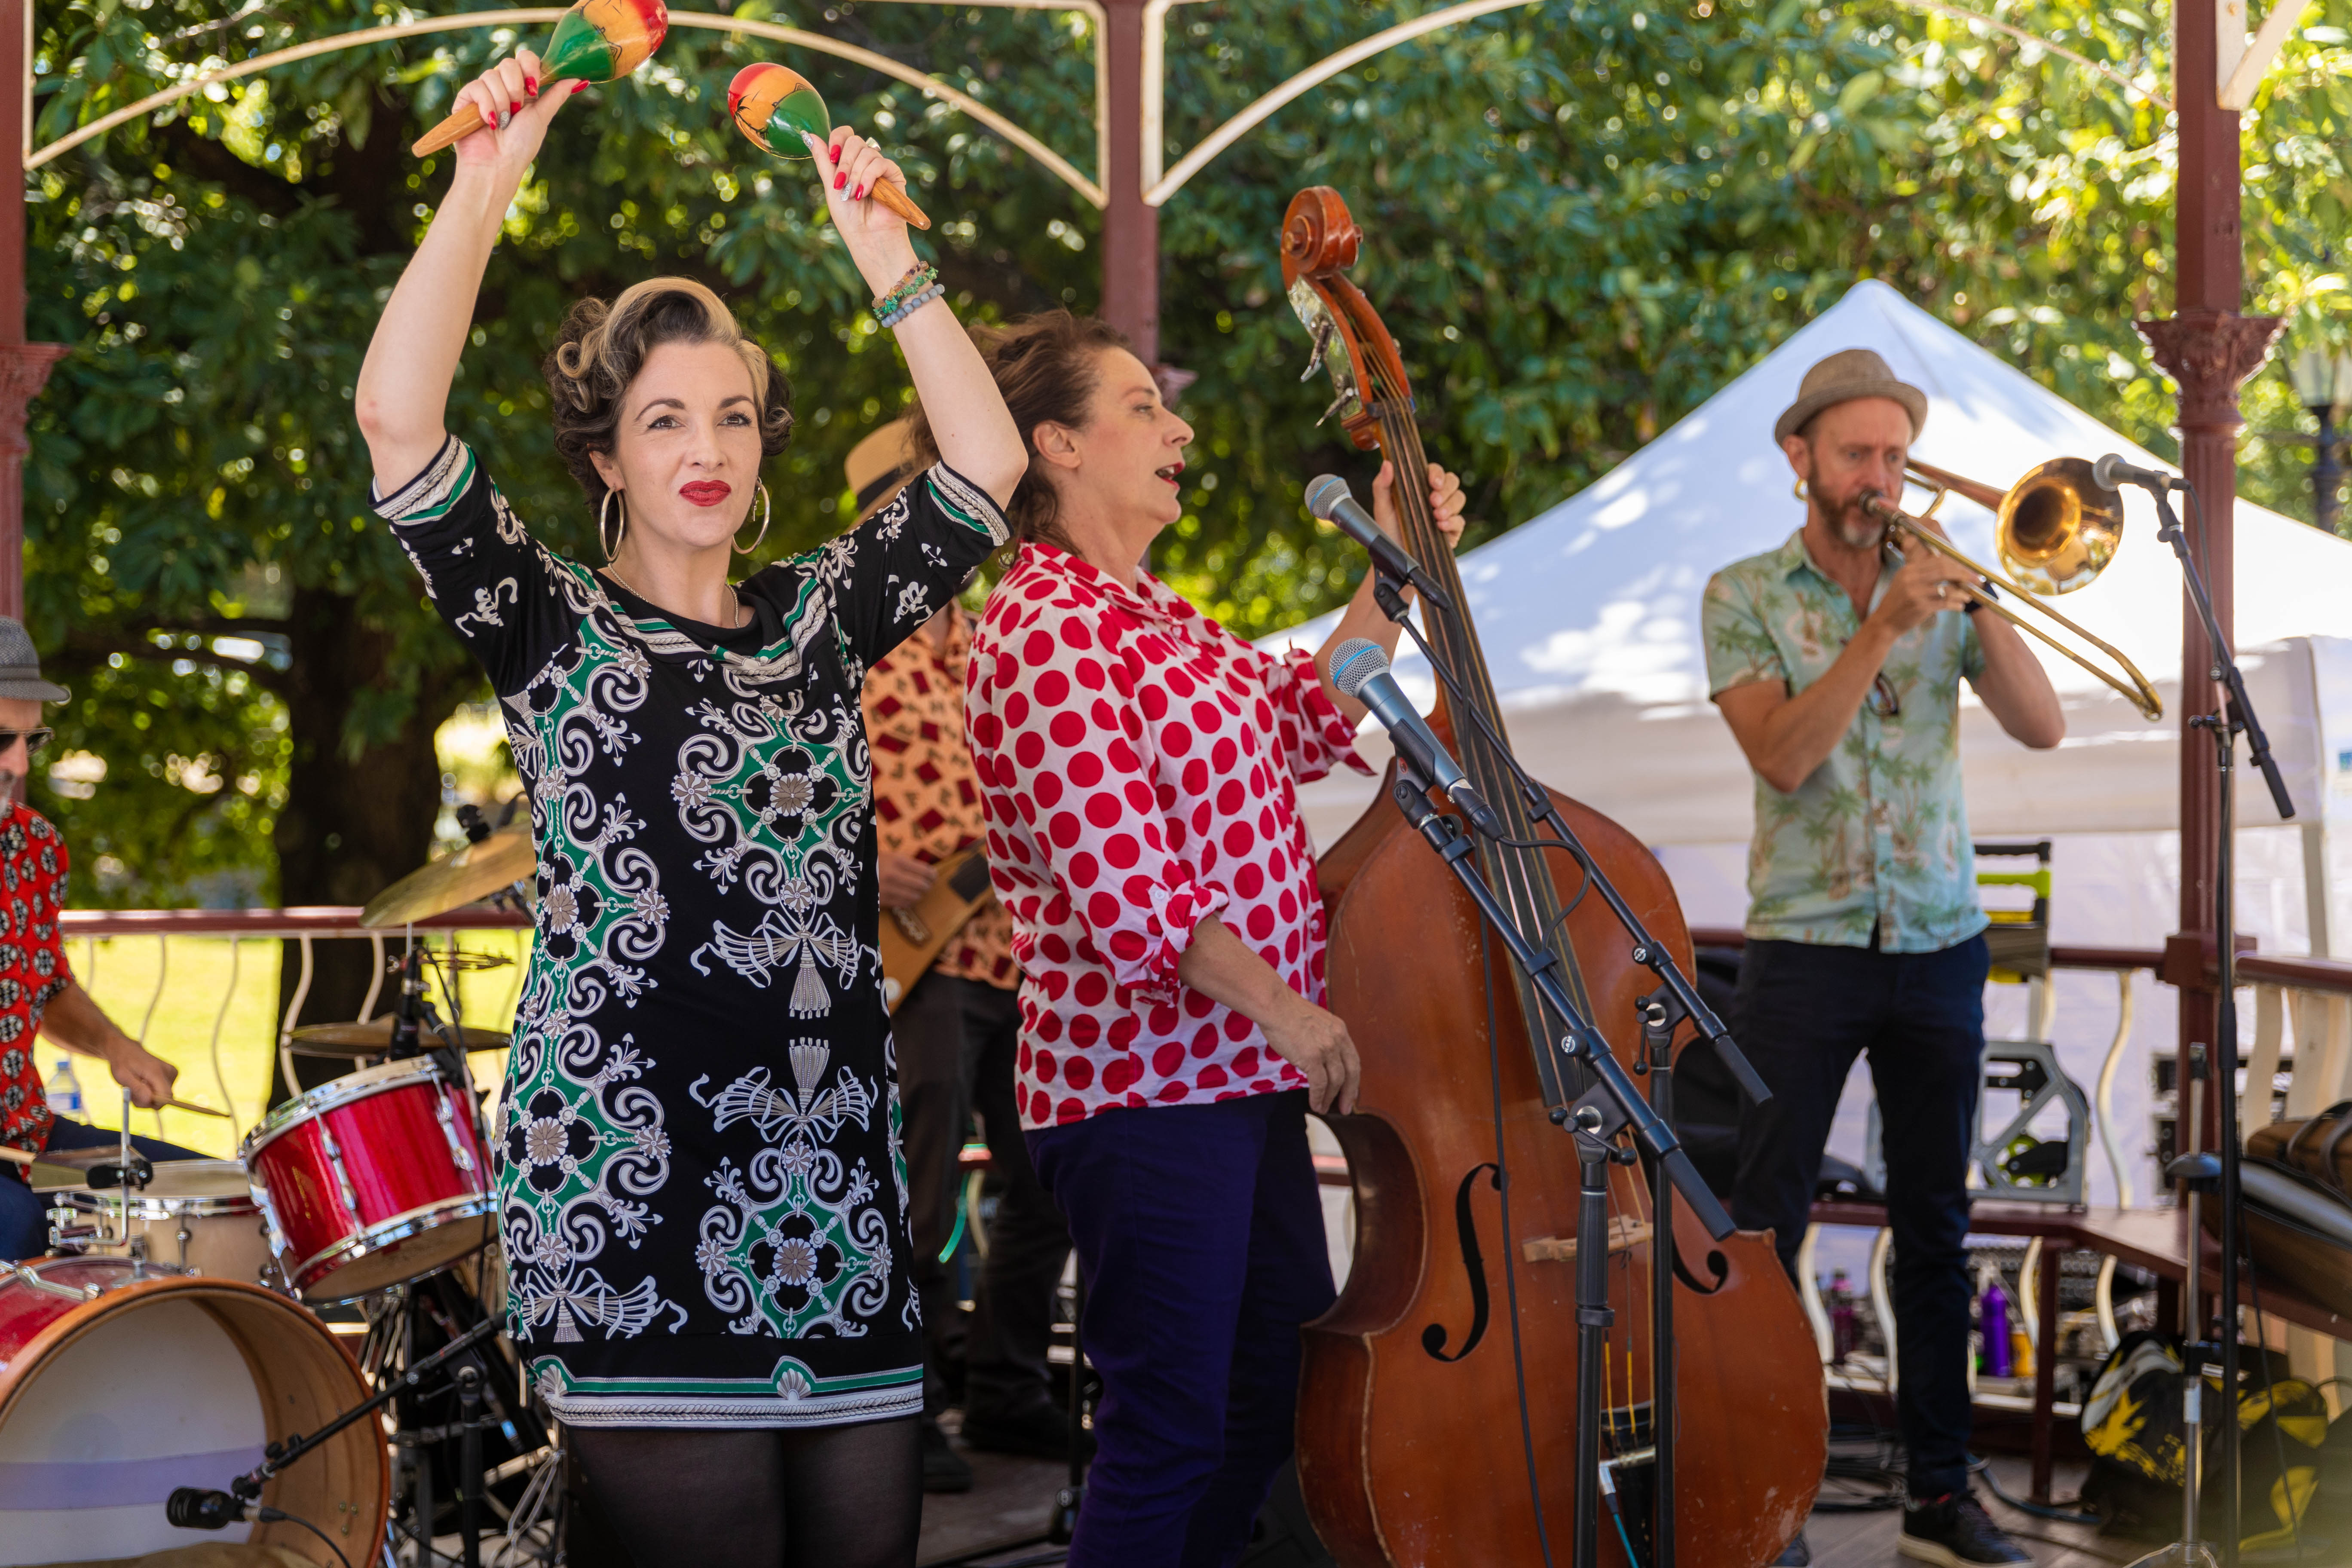
Case study: Summer in the Park
Summer in the Park is a popular annual program of arts and culture events, staging entertainment for all ages in some of Boroondara’s favourite parks and gardens.
The Boroondara community responded strongly to the Summer in the Park program. This program of arts and culture events resulted in:
- 18 events hosted for Summer in the Park throughout February and March 2022
- All events were free of charge with theatre performances offered for the first time
- Over 4,000 attendees were attracted to the performances throughout the series.
The program also helped to creatively activate public parks throughout the municipality, and created an opportunity for Boroondara Arts and independent artists to reengage with audiences in a live setting.
Theme 1 performance
Below is a breakdown of the strategic indicators, progress of initiatives and other service performance indicators for this theme. You can find out more detail about these indicators and previous year’s results in the full report.
You can also read through our continuous improvement initiatives, community engagement, and benchmarking activities for this theme in the full report.
Strategic indicators
In almost all cases our strategic indicators saw consistent or improved results in FY2021-22. The strategic indicators that met or exceeded the forecast include the following.
Percentage of graffiti removed from Council owned assets within one business day of notification:
100%
Number of arts and cultural community events delivered or supported by Council:
234 events
Audience satisfaction with Boroondara Arts curated programs and events:
85%
Number of community groups using council facilities directly under a lease or license agreement:
192 groups
Number of people participating in active ageing programs and events:
1,105 participants
Number of vaccinations administered:
20,374 vaccinations
Number of attendances by young people at youth programs or services:
8,840 attendences
Number of community organisations funded through the Community Strengthening Grant Program:
208 organisations
Food safety assessments (percentage of registered class 1 food premises and class 2 food premises that receive an annual food safety assessment):
100%
Percentage of community strengthening grants provided to culturally and linguistically diverse and disability groups:
18%
Some indicators did not meet our forecast this year:
- The satisfaction with recreational facilities (76, out of 100). The slight decline from last year (79, out of 100) still has us significantly above both metro and state-wide averages. It is largely attributed to personal users, men, and residents aged 18 to 34 years, who rated Council’s performance in this area significantly lower than in FY2020-21.
- Overall participation in library services, which includes loans, returns, visits, program attendances, e-books and audio loans, enquiries, reservations, Wi-Fi, and virtual visits (6,513,131 participants). Although this is below our forecast it is an increase on the previous year’s result reflecting a growing confidence by the community in returning to library spaces.
Progress of initiatives in the Budget
All initiatives for this theme aside from one were completed in FY2021-22. These include:
- presenting a draft Boroondara Volunteer Resource Centre Strategic Service Plan and achieving an additional 25 new member organisations annually
- opening the renewed Alamein Neighbourhood and Learning Centre
- undertaking a Workplace Gender Audit and preparing a Gender Equality Action Plan
- delivering a program to support older residents to improve their digital capabilities
- developing a Community Resilience Framework
- increasing the number of physical and electronic library loans by 5%
- increasing the Summer in the Park programming with two additional events
- supporting 10 creative activation and installations across parks, laneways, and public areas
- providing 25 individual grants for low-income earners or people facing disadvantage
- delivering targeted health and wellbeing programs for young people
- adopting the revised Road Management Plan
- conducting a communications campaign to pool and spa owners about their responsibilities
- developing and adopting the Asset Plan in accordance with Local Government Act 2020 requirements
- implementing the Capital Works Renewal Program.
We also completed the major initiative of progressing the Kew Recreation Centre to at least 45% to create a recreation facility to meet current and future community needs.
The one remaining initiative, progressing the Canterbury Community Precinct construction, is 85% completed. This was delayed by COVID-19 related supply chain issues. The Canterbury Community Precinct Stage One works are anticipated to be completed by October 2022 and Stage 2 works are anticipated to be completed by early to mid-2023.
Other service performance indicators
The following other service performance indicators and measures are based on the FY2021-22, unless stated otherwise. You can find out more detail including how these indicator results were calculated in the full report.
Animal management
Time taken to action animal management requests
FY2021-22: 1.16 days
FY2020-21: 1.25 days
Cost of animal management service
FY2021-22: $7.89 per municipal population member
FY2020-21: $7.84 per municipal population member
Animal management prosecutions
FY2021-22: 100%
FY2020-21: 100%
Animals reclaimed
FY2021-22: 68%
FY2020-21: 48%
High rate of reclaimed animals continues in line with high registration levels. Increase in registrations means we have more up to date contact details for pet owners, leading to higher reclaim rates.
Animals rehomed
FY2021-22: 17%
FY2020-21: 10.7%
A higher number of cats being surrendered or brought in by the public has resulted in less reclaims (animals collected). The majority of animals brought in by the public were not registered, so need to be adopted or fostered.
Aquatic facilities
Health inspections of aquatic facilities
FY2021-22: 1 health inspection
FY2020-21: 0.33 inspections
Utilisation of aquatic facilities
FY2021-22: 7.65 visits per head of municipal population
FY2020-21: 5 visits per head of municipal population
Cost of aquatic facilities
FY2021-22: $0.88 per visit
FY2020-21: $2.24 per visit
Improved outcome due to lockdowns being lifted. Although not back to pre-pandemic levels, attendance is improving slowly.
Food safety
Cost of food safety service
FY2021-22: $318 per registered or notified food premises
FY2020-21: $381 per registered or notified food premises
Time taken to action food complaints
FY2021-22: 1.4 days
FY2020-21: 1.7 days
Food safety assessments completed
FY2021-22: 100%
FY2020-21: 100%
Critical and major non-compliance outcome notifications followed up
FY2021-22: 93%
FY2020-21: 96%
Maternal and Child Health (MCH)
Cost of the MCH service
FY2021-22: $75.27 per hour of service delivered
FY2020-21: 70.77 per hour of service delivered
Participation in the MCH service
FY2021-22: 81%
FY2020-21: 81%
Participation in the MCH service by Aboriginal children
FY2021-22: 93%
FY2020-21: 96%
Infant enrolments in MCH service
FY2021-22: 101%
FY2020-21: 100%
Result is above 100% as more infants have enrolled with Boroondara than birth notifications received.
Participation in 4-week Key age and stage (KAS) visits
FY2021-22: 102%
FY2020-21: 102%
Result over 100% as attendance for 4-week Key age and stage (KAS) visits has been above birth notifications received.
Libraries
Physical library collection usage
FY2021-22: 3 loans per physical library collection item
FY2020-21: 3 loans per physical library collection item
Recently purchased library collection (last 5 years)
FY2021-22: 63%
FY2020-21: 60%
Active library borrowers in municipality
FY2021-22: 21%
FY2020-21: 22%
Cost of library service per population member
FY2021-22: $50
FY2020-21: $48